
Existing Home Sales Surge Forward Through Fall [INFOGRAPHIC]
![Existing Home Sales Surge Forward Through Fall [INFOGRAPHIC] | Simplifying The Market](https://files.keepingcurrentmatters.com/wp-content/uploads/2016/11/20161125-EHS-Report-STM.jpg)
Some Highlights:
- The National Association of Realtors (NAR) recently released their latest Existing Home Sales Report.
- First-time homebuyers made up 33% of all sales in October.
- Homes are selling quickly with 43% of homes on the market for less than a month.
- A limited supply continues to drive up prices for the 56th consecutive month.
Homes Across the Country Are Selling Fast! [INFOGRAPHIC]
![Homes Across the Country Are Selling Fast! [INFOGRAPHIC] | Simplifying The Market](https://files.keepingcurrentmatters.com/wp-content/uploads/2016/11/20161118-Days-on-the-Market-STM.jpg)
Some Highlights:
- The National Association of REALTORS® surveyed their members for the release of their Confidence Index.
- The REALTORS® Confidence Index is a key indicator of housing market strength based on a monthly survey sent to over 50,000 real estate practitioners. Practitioners are asked about their expectations for home sales, prices and market conditions.
- Homes sold in 60 days or less in 42 out of 50 states, and Washington D.C.
- Homes sold in 30 days or less in 17 states.
The Difference an Hour Makes This Fall [INFOGRAPHIC]
![The Difference an Hour Makes This Fall [INFOGRAPHIC] | Simplifying The Market](https://files.keepingcurrentmatters.com/wp-content/uploads/2016/10/20161104-ENG-STM.jpg)
Every Hour in the US Housing Market:
- 633 Homes Sell
- 253 Homes Regain Positive Equity
- Median Home Values Go Up $1.43
Buying a Home Can Be Scary... Know the Facts [INFOGRAPHIC]
![Buying a Home Can Be Scary... Know the Facts [INFOGRAPHIC] | Simplifying The Market](https://files.keepingcurrentmatters.com/wp-content/uploads/2016/10/20161028-ENG-STM.jpg)
Some Highlights:
- 36% of Americans think they need a 20% down payment to buy a home.
- 44% of Millennials who purchased a home this year have put down less than 10%.
- 71.8% of loan applications were approved last month.
- The average credit score of approved loans was 731 in September.
7 Graphs That Show the Real Estate Market Is Back! [INFOGRAPHIC]
![7 Graphs That Show the Real Estate Market is Back! [INFOGRAPHIC] | Simplifying The Market](https://files.keepingcurrentmatters.com/wp-content/uploads/2016/10/20161021-STM-1.jpg)
Some Highlights:
- Distressed property sales fell to its lowest number since NAR began tracking it in 2008.
- As you can see, with less distressed properties, sales are up in all price ranges except the $0 - $100K price range.
- Interest rates are still at historic lows, signifying that now is the right time to buy!
Foreclosure Rate Drops to Pre-Crisis Levels [INFOGRAPHIC]
![Foreclosure Rate Drops to Pre-Crisis Levels [INFOGRAPHIC] | Simplifying The Market](https://files.keepingcurrentmatters.com/wp-content/uploads/2016/09/Corelogic-Foreclosure-STM.jpg)
Some Highlights:
- Only 2.9% of homes are in serious delinquency, down 17.1% from July 2015.
- This is the 57th consecutive month with a year-over-year decline.
- The national foreclosure rate has returned to August 2007 levels, at only 0.9%.
50% of Houses Sold in 36 Days or Less in July [INFOGRAPHIC]
![50% of Houses sold in 36 Days or Less in July [INFOGRAPHIC] | Simplifying The Market](https://files.keepingcurrentmatters.com/wp-content/uploads/2016/09/20160916-STM-ENG.jpg)
Some Highlights:
- The National Association of REALTORS® surveyed their members for their Confidence Index
- The REALTORS® Confidence Index is a key indicator of housing market strength based on a monthly survey sent to over 50,000 real estate practitioners. Practitioners are asked about their expectations for home sales, prices and market conditions.
- Homes sold in less than 60 days in 38 out of 50 states and Washington D.C.
- Homes sold in less than 30 days in 17 states
Home Prices Up 5.61% Across The Country! [INFOGRAPHIC]
![Home Prices Up 5.61% Across The Country! [INFOGRAPHIC] | Simplifying The Market](https://files.keepingcurrentmatters.com/wp-content/uploads/2016/09/20160909-STM-ENG.jpg)
Some Highlights:
- The Federal Housing Finance Agency (FHFA) recently released their latest Quarterly Home Price Index report.
- In the report, home prices are compared both regionally and by state.
- Based on the latest numbers, if you plan on relocating to another state, waiting to move may end up costing you more!
- Vermont was the only one state where home prices are actually lower than they were last year.
Want to Get an A? Hire A Real Estate Pro [INFOGRAPHIC]
![Want to Get an A? Hire A Real Estate Pro [INFOGRAPHIC] | Simplifying The Market](https://files.keepingcurrentmatters.com/wp-content/uploads/2016/08/A-Reasons-To-Use-A-RE-Pro-STM.jpg)
Some Highlights:
- Hiring a Real Estate Professional to buy your dream home, or sell your current house, is one of the most 'educated' decisions you can make!
- A Real Estate Professional has the experience needed to help you through the entire process.
- Make sure that you hire someone who knows current market conditions & can simply & effectively explain them to you & your family!
How Supply & Demand Impacts the Real Estate Market [INFOGRAPHIC]
![How Supply & Demand Impacts the Real Estate Market [INFOGRAPHIC] | Simplifying The Market](https://files.keepingcurrentmatters.com/wp-content/uploads/2016/08/201660826-STM-ENG.jpg)
Some Highlights:
- The concept of Supply & Demand is a simple one. The best time to sell something is when supply of that item is low & demand for that item is high!
- Anything under a 6-month supply is a Seller’s Market!
- There has not been a 6-months inventory supply since August 2012!
- Buyer Demand continues to outpace Seller Supply!
‘Old Millennials’ Are Diving Head-First into Homeownership [INFOGRAPHIC]
![‘Old Millennials’ Are Diving Head-First into Homeownership [INFOGRAPHIC] | Simplifying The Market](https://files.keepingcurrentmatters.com/wp-content/uploads/2016/08/Old-Millennials-ENG-STM.jpg)
Some Highlights:
- ‘Old Millennials’ are defined as 25-36 year olds according to the US Census Bureau.
- According to NAR’s latest Profile of Home Buyers & Sellers, the median age of all first-time home buyers is 31 years old.
- More and more ‘Old Millennials’ are realizing that homeownership is within their reach now!
What States Give You the Most ‘Bang for Your Buck’? [INFOGRAPHIC]
![What States Give You the Most ‘Bang for Your Buck’? [INFOGRAPHIC] | Simplifying The Market](https://files.keepingcurrentmatters.com/wp-content/uploads/2016/08/20160812-100-Gets-You-STM.jpg)
Some Highlights:
- Thinking of moving across the country? How far will your money take you?
- The majority of states in the Midwest and South offer a lower cost of living compared to Northeast and Western states.
- The ‘Biggest Bang for your Buck’ comes in Mississippi where, compared to the national average, you can actually purchase $115.34 worth of goods for $100.
Do You Know the Impact Your Interest Rate Makes? [INFOGRAPHIC]
![Do You Know the Impact Your Interest Rate Makes? [INFOGRAPHIC] | Simplifying The Market](https://files.keepingcurrentmatters.com/wp-content/uploads/2016/08/20150805-Cost-of-Interest-STM.jpg)
Some Highlights:
- Interest rates have come a long way in the last 30 years.
- The interest rate you secure directly impacts your monthly payment and the amount of house that you can afford if you plan to stay within a certain budget.
- Interest rates are at their lowest in years… RIGHT NOW!
- If buying your first home, or moving up to the home of your dreams is in your future, now may be the time to act!
Home Sales Accelerate During The “Dog Days of Summer” [INFOGRAPHIC]
![Home Sales Accelerate During The “Dog Days of Summer” [INFOGRAPHIC] | Simplifying The Market](https://files.keepingcurrentmatters.com/wp-content/uploads/2016/07/20160729-Dog-Days-of-Summer-STM.jpg)
Some Highlights:
- Existing home sales have accelerated to the highest pace since February 2007 at an annual pace of 5.57 million.
- Inventory of homes for sale remains below the historically normal 6-month mark at a 4.6-month supply, down 5.8% year-over-year.
- Median home sales prices rose to $247,700, 4.8% higher than a year ago and replaced the previous peak in May of $238,900.
Slaying Myths About Home Buying [INFOGRAPHIC]
![Slaying Myths About Home Buying [INFOGRAPHIC] | Simplifying The Market](https://files.keepingcurrentmatters.com/wp-content/uploads/2016/07/Slaying-Myths-STM-1.jpg) Some Highlights:
Some Highlights:
- Interest Rates are still below historic numbers.
- 88% of property managers raised their rent in the last 12 months!
- Credit score requirements to be approved for a mortgage continue to fall.
Should I Wait Until Next Year? Or Buy Now? [INFOGRAPHIC]
![Should I Wait Until Next Year? Or Buy Now? [INFOGRAPHIC] | Simplifying The Market](https://files.keepingcurrentmatters.com/wp-content/uploads/2016/07/Cost-of-Waiting-STM.jpg)
Some Highlights:
- The Cost of Waiting to Buy is defined as the additional funds it would take to buy a home if prices & interest rates were to increase over a period of time.
- Freddie Mac predicts interest rates to rise to 4.6% by next year.
- CoreLogic predicts home prices to appreciate by 5.3% over the next 12 months.
- If you are ready and willing to buy your dream home, find out if you are able to!
Saving To Buy A Home? What Would You Sacrifice? [INFOGRAPHIC]
![Saving To Buy A Home? What Would You Sacrifice? [INFOGRAPHIC] | Simplifying The Market](https://files.keepingcurrentmatters.com/wp-content/uploads/2016/07/Sacrifices-to-Buy-BOA-STM.jpg)
Some Highlights:
- 95% of first-time homebuyers are willing to sacrifice to make homeownership a reality.
- The top thing that buyers sacrifice are new clothes at 54%.
- Even repeat or experienced buyers say they sacrificed taking a vacation or buying a new car to buy their last home.
Sales at Highest Pace in 9 Years! [INFOGRAPHIC]
![Sales at Highest Pace in 9 Years [INFOGRAPHIC] | Simplifying The Market](https://files.keepingcurrentmatters.com/wp-content/uploads/2016/06/Sales-Highest-in-9-Years-STM-.jpg)
Some Highlights:
- Sales of existing homes reached the highest annual pace in over 9 years at 5.29 million.
- Inventory remains below the 6-month norm and prices are still on the rise.
- Interest rates are at a historic low of 3.48%.
Thinking You Should FSBO? Think Again [INFOGRAPHIC]
![Thinking You Should FSBO? Think Again [INFOGRAPHIC] | Simplifying The Market](https://files.keepingcurrentmatters.com/wp-content/uploads/2016/06/20160624-ENG-STM.jpg) Some Highlights:
According to NAR's Profile of Home Buyers & Sellers:
Some Highlights:
According to NAR's Profile of Home Buyers & Sellers:
- 88% of buyers look for their new home online.
- Using a real estate agent can net you $39,000 more than FSBO'ing.
- There is a long list of people that you will have to negotiate with when you decide to sell your home, using an experienced professional can help ease the process.
Foreclosure Rate Drops to New Post-Crisis Low [INFOGRAPHIC]
![Foreclosure Rate Drops to New Post-Crisis Low [INFOGRAPHIC] | Simplifying The Market](https://files.keepingcurrentmatters.com/wp-content/uploads/2016/06/Corelogic-Foreclosure-STM.jpg)
Some Highlights:
- According to CoreLogic, the national foreclosure rate dropped to 1.1% of all homes with a mortgage. This is the lowest percentage experienced since October 2007.
- April marked the 54th consecutive month of year-over-year declines in foreclosure inventory.
- Only 3% of homes in the United States are in serious delinquency. More and more homeowners are escaping negative equity as prices rise.
Home Prices Up 5.67% Across The Country! [INFOGRAPHIC]
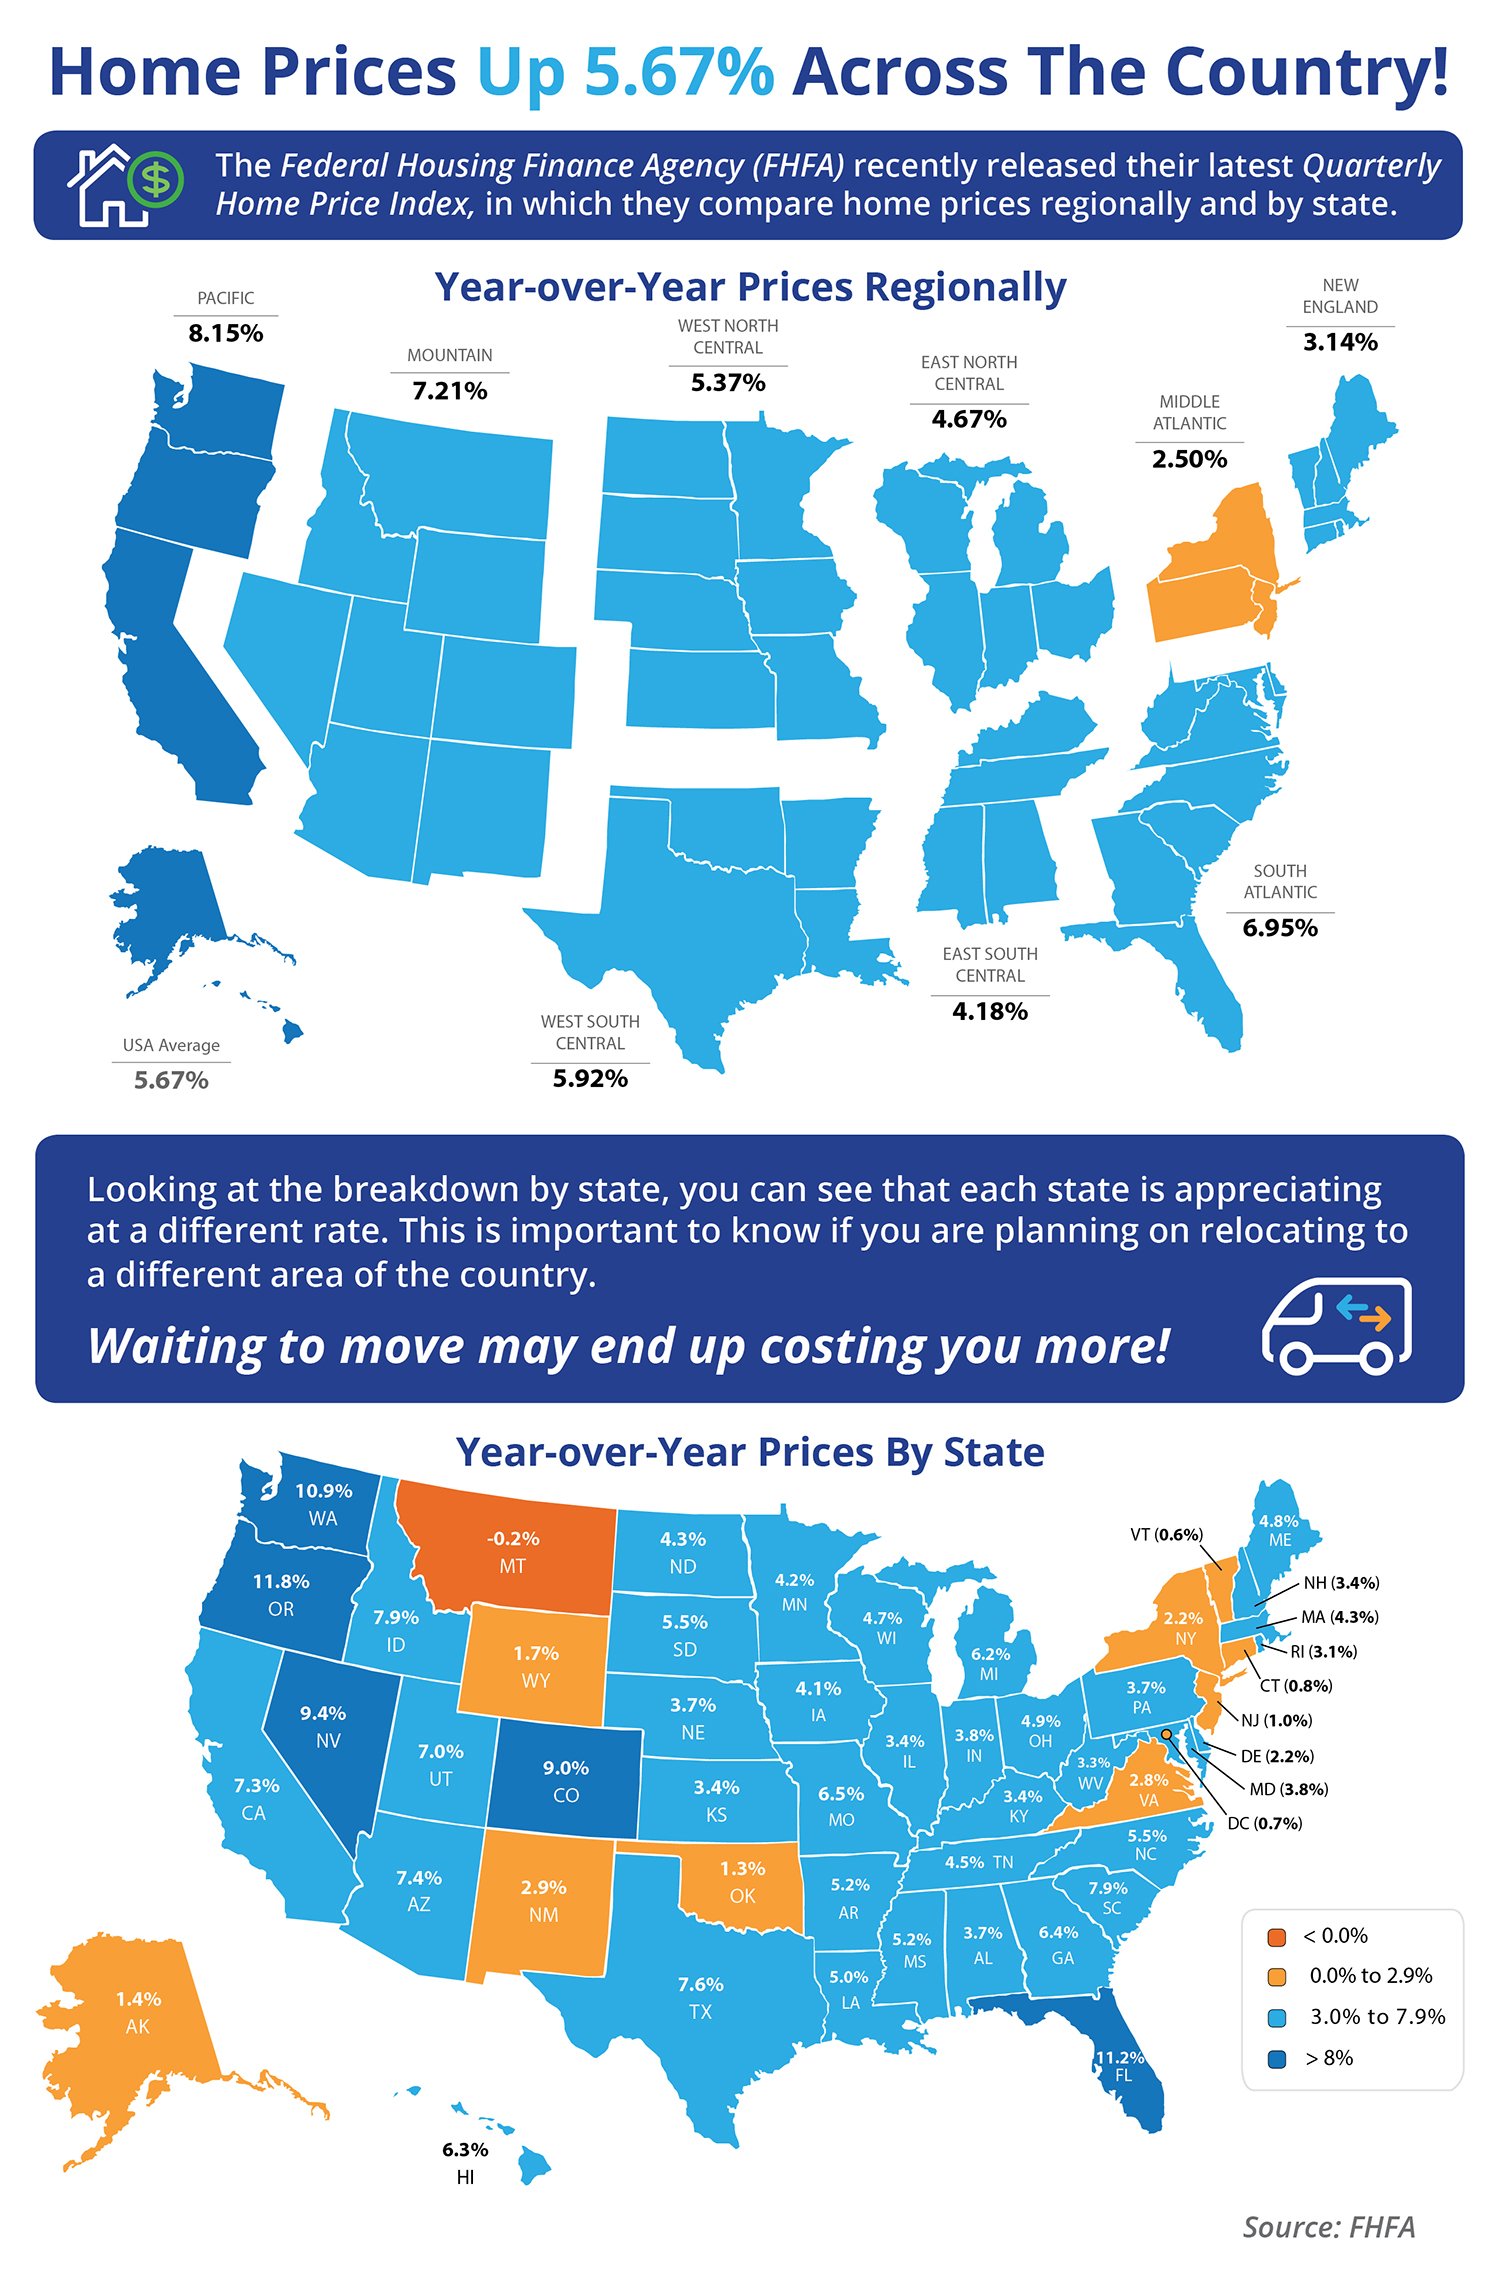
Some Highlights:
- Across the country, home prices are up by 5.67%.
- Each state is appreciating at a different rate, however, which is important to realize if you plan on relocating to a different state.
- Regionally, prices have appreciated year-over-year by as high as 8.15%.
June is National Homeownership Month! [INFOGRAPHIC]

Some Highlights:
- Paying rent is not a good investment, but owning is a great way to start building family wealth.
- Not only does homeownership allow you to provide your children with great education, but you can also decide whether or not your child grows up with a pet.
- Owning a home provides you with tax benefits while also providing you with more living space to move around in.
New & Existing Home Sales Climb [INFOGRAPHIC]
![New & Existing Home Sales Climb [INFOGRAPHIC] | Simplifying The Market](https://files.keepingcurrentmatters.com/wp-content/uploads/2016/05/20160527-EHS-APR-STM.jpg)
Some Highlights:
- Both New Home Sales and Existing Home Sales are up month-over-month and year-over-year.
- Inventory remains low which continues to drive home prices up as demand continues to exceed the 4.7-month inventory.
- The median price of new homes is up 12% from March 2016, while the median price of existing homes is up 6.3% from April 2015.
Renting vs. Buying: What Does it Really Cost? [INFOGRAPHIC]
![Renting vs. Buying: What Does it Really Cost? [INFOGRAPHIC] | Simplifying The Market](https://files.keepingcurrentmatters.com/wp-content/uploads/2016/05/Rent-vs.-Buy-STM.jpg)
Some Highlights:
- The percentage of income needed to afford a median priced home is almost half the percentage of income needed to afford median rent.
- Buying costs are significantly less than renting costs.
- The percentage of income needed to afford a median priced home is less than the historic norm.
Housing Market Snapshot [INFOGRAPHIC]
![Housing Market Snapshot [INFOGRAPHIC] | Simplifying The Market](https://files.keepingcurrentmatters.com/wp-content/uploads/2016/05/Housing-Market-Update-STM.jpg)
Some Highlights:
- Home sales are up 1.5% year-over-year and 5.1% month-over-month.
- Demand is still much higher than the available housing inventory which declined 2.2% from March 2015.
- This is the 49th consecutive month with year-over-year price gains.