Why Affordability is NOT the Biggest Obstacle to Homeownership
It seems you can’t find a headline with the term “housing affordability” without the word “crisis” attached to it. That’s because some only consider the fact that residential real estate prices have continued to appreciate.
A recent survey by CoreLogic showed that the number one obstacle to homeownership in people’s minds was affordability. Not down payment. Not credit score. Affordability.
Now, it makes sense that this is something people are talking about. Prices HAVE certainly gone up – and affordability is not where it was ten years ago.
But we have to remember ten years ago following the Great Recession, interest rates dropped to all-time lows and prices dropped dramatically. So, it’s clear why many people are led to believe affordability was better then than it is now.
Let’s break down four key reports that show why housing affordability is not what many headlines are making it out to be across the country.
1. National Association of Realtors’ (NAR) Housing Affordability Index
This graph in the video shows the index going all the way back to 1990. The higher the column, the more affordable homes are.
We can see that homes are less affordable today than they were during the housing crash. This was when distressed properties like foreclosures and short sales saturated the market and sold for massive discounts.
However, homes are more affordable today than at any time from 1990 to 2008.
2. CoreLogic’s National Homebuyers’ “Typical Mortgage Payment”
This is also the case for mortgage payments. CoreLogic just released their Typical Mortgage Payment report, which shows the average monthly mortgage payment over the past 20 years – adjusted for inflation.
The results? The typical mortgage payment today is less than what it was during the housing boom of the mid-2000s all the way back to the beginning of the decade.
3. National Association of Realtors’ (NAR) Payment As a Percent of Income
Part of the reason for this is because wages are going up and interest rates are lower.
If we look at Payment as a Percentage of Income, it has been falling since June of last year from 18.2% – with a slight rise in recent months now up to 16.6%.
The best part about this? All of these months are still much lower than the historic norm – which is 21.2% of income being spent on monthly mortgage payments.
So while prices have gone up and it’s not the same market we had ten years ago – housing is still more affordable now than it has been historically in normal markets.
4. First American’s Real House Price Index
So with prices rising, how does that make homes more affordable? It’s due in large part because the 30-year Fixed Mortgage Rate has dropped almost a full point in the last eight months from 4.75% to 3.75%.
Mark Fleming, the Chief Economist at First American, recently said “If the 30-year, fixed-rate mortgage declines just a fraction more” – and some people are projecting that to happen – “consumer house-buying power could reach its highest level in almost 20 years.”
So, not only is affordability not a challenge, it might be the best it’s been in 20 years if the interest rates just drop a little bit more. And that’s BIG!
Bottom Line
With so many media outlets reporting misleading information about real estate, it’s more important than ever that we reclaim the narrative of what’s really happening in the market.
You need the right resources and information backing you, that’s the only way to face the coming challenges of tomorrow and be the trusted advisor to your clients.
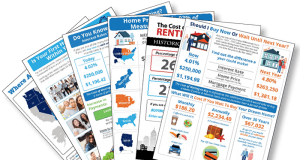
That’s why we’re giving you these powerful visuals referencing everything we’ve talked about today as a FREE download. Print them out, keep them on your phone or tablet – you will use them in so many of the presentations and conversations you’ll have coming up.


