
Home Values: DEFINITELY NOT in Bubble Range!!

There are some industry pundits claiming that residential home values have risen too quickly and that current levels are on the verge of another housing bubble. It is easy to see how this thinking has taken form if we look at a graph of home prices from 2000 to today.
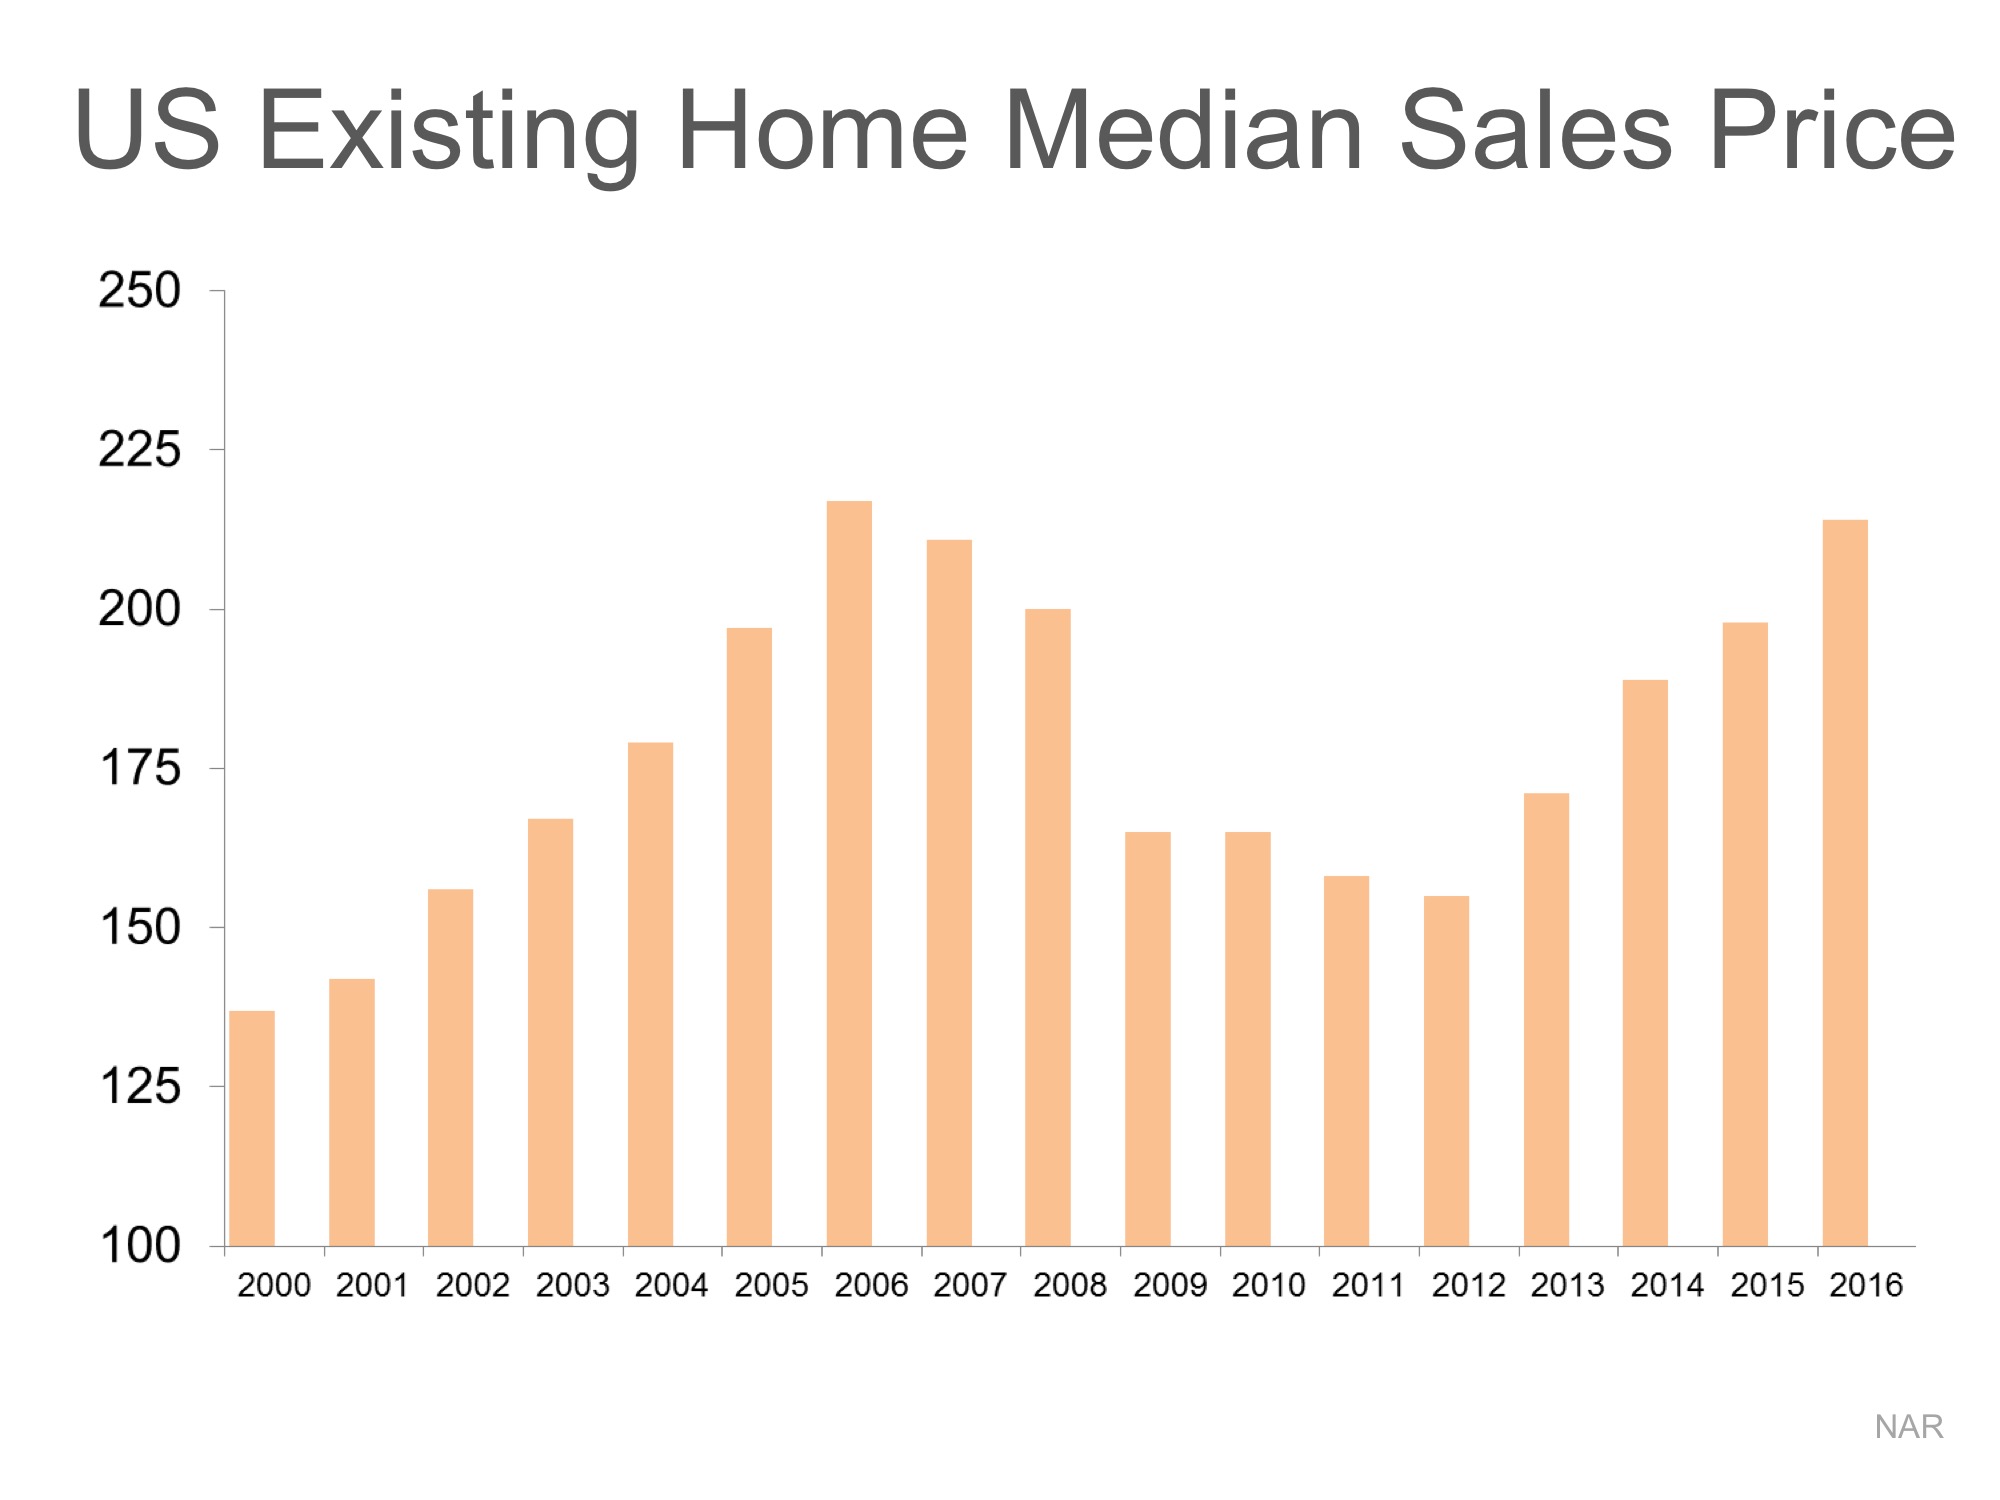
The graph definitely looks like a rollercoaster ride. And, as prices begin to reach 2006 levels again, it “seems logical” that the next part of the ride would be downhill. However, this graph includes the anomaly of the price bubble and the correction (the housing crash).
What if the bubble & bust didn’t occur?
Let’s assume that instead of the rise and fall in home prices that we saw last decade, we just had normal historic appreciation from 2000 to today. According to the 100+ experts that are surveyed for the Home Price Expectation Survey, normal annual appreciation for residential single family homes from 1987 to 1999 was 3.6%.
Starting with the median home price in 2000, we added 3.6% to it each year since then. Here is that graph intermixed with the above graph.
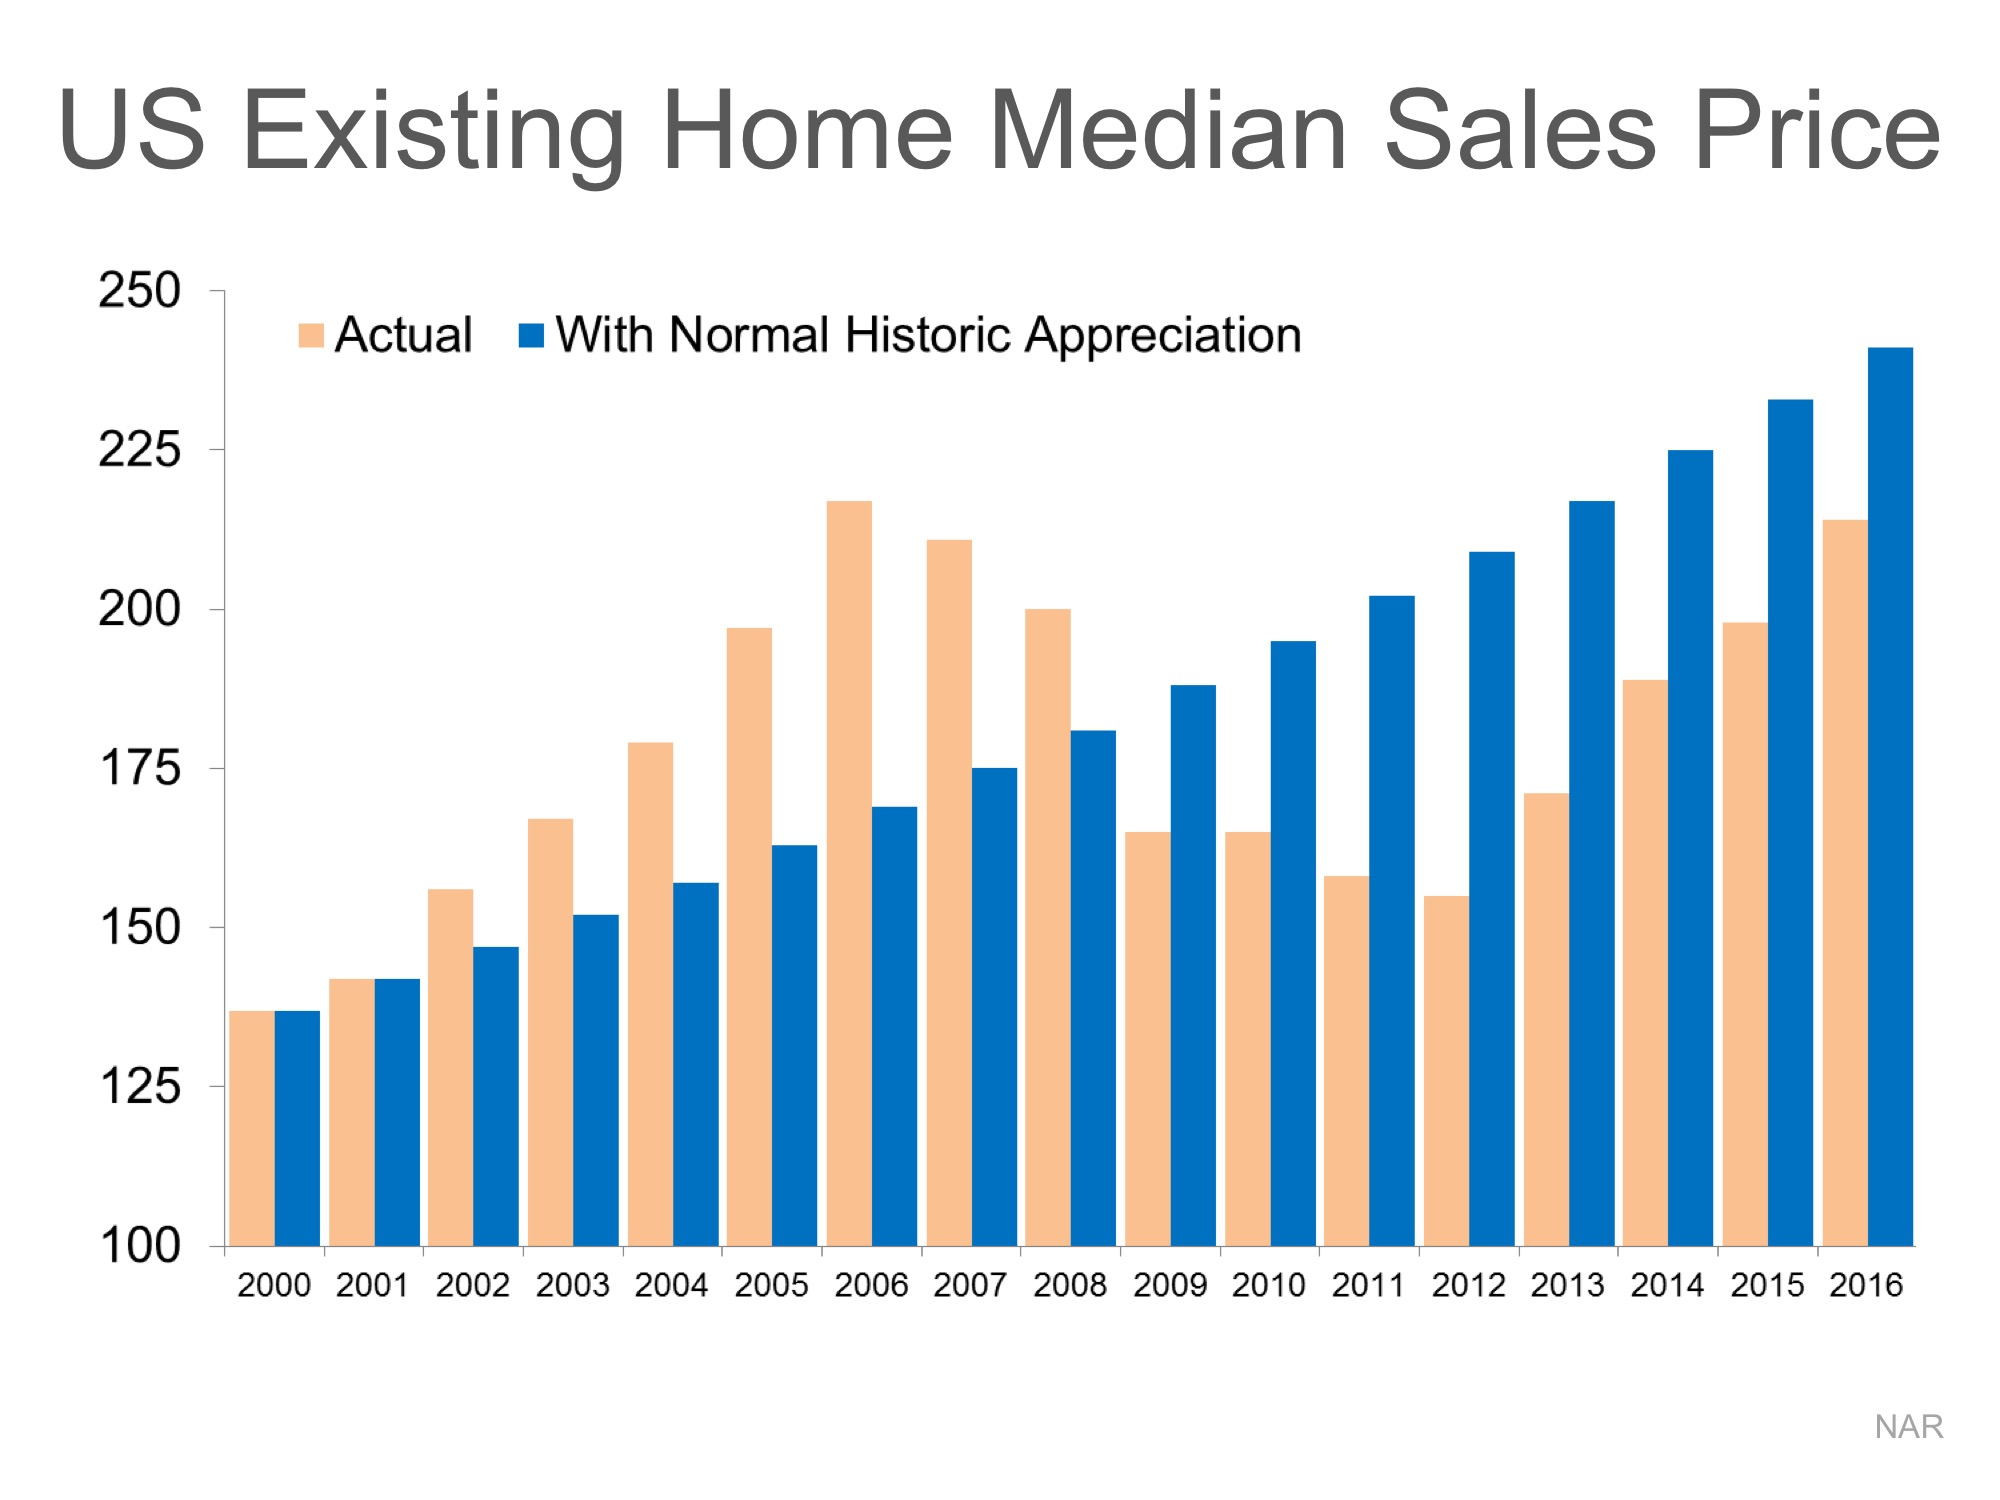
What this shows us is that, had the bubble and crash not occurred and instead we just had normal annual appreciation over this period, prices would actually be greater than they are today.
Bottom Line
There is no reason for alarm as prices seem to be right in line with where they should be.

|
Members: Sign in now to set up your Personalized Posts & start sharing today!
Not a Member Yet? Click Here to learn more about KCM’s newest feature, Personalized Posts. |