Keeping Current Matters
  • Products
    • Social Edge
    • Playbooks
    • RealTalk
  • Market Insights
  • Pricing
  • Blog
  • Login
  • Start a Free Trial
  • Menu Menu
  • English
  • Español
AGENTS: Did you know you can share a personalized version of this post? Learn more!
For Buyers, For Sellers, Home Prices, First-Time Buyers, Move-Up

What Impact Will the New Tax Code Have on Home Values?

What Impact Will the New Tax Code Have on Home Values?
  • Facebook
  • Twitter
  • Pinterest
  • LinkedIn

Every month, CoreLogic releases its Home Price Insights Report. In that report, they forecast where they believe residential real estate prices will be in twelve months.

Below is a map, broken down by state, reflecting how home values are forecasted to change by the end of 2018 using data from the most recent report.

What Impact Will the New Tax Code Have on Home Values? | Simplifying The Market

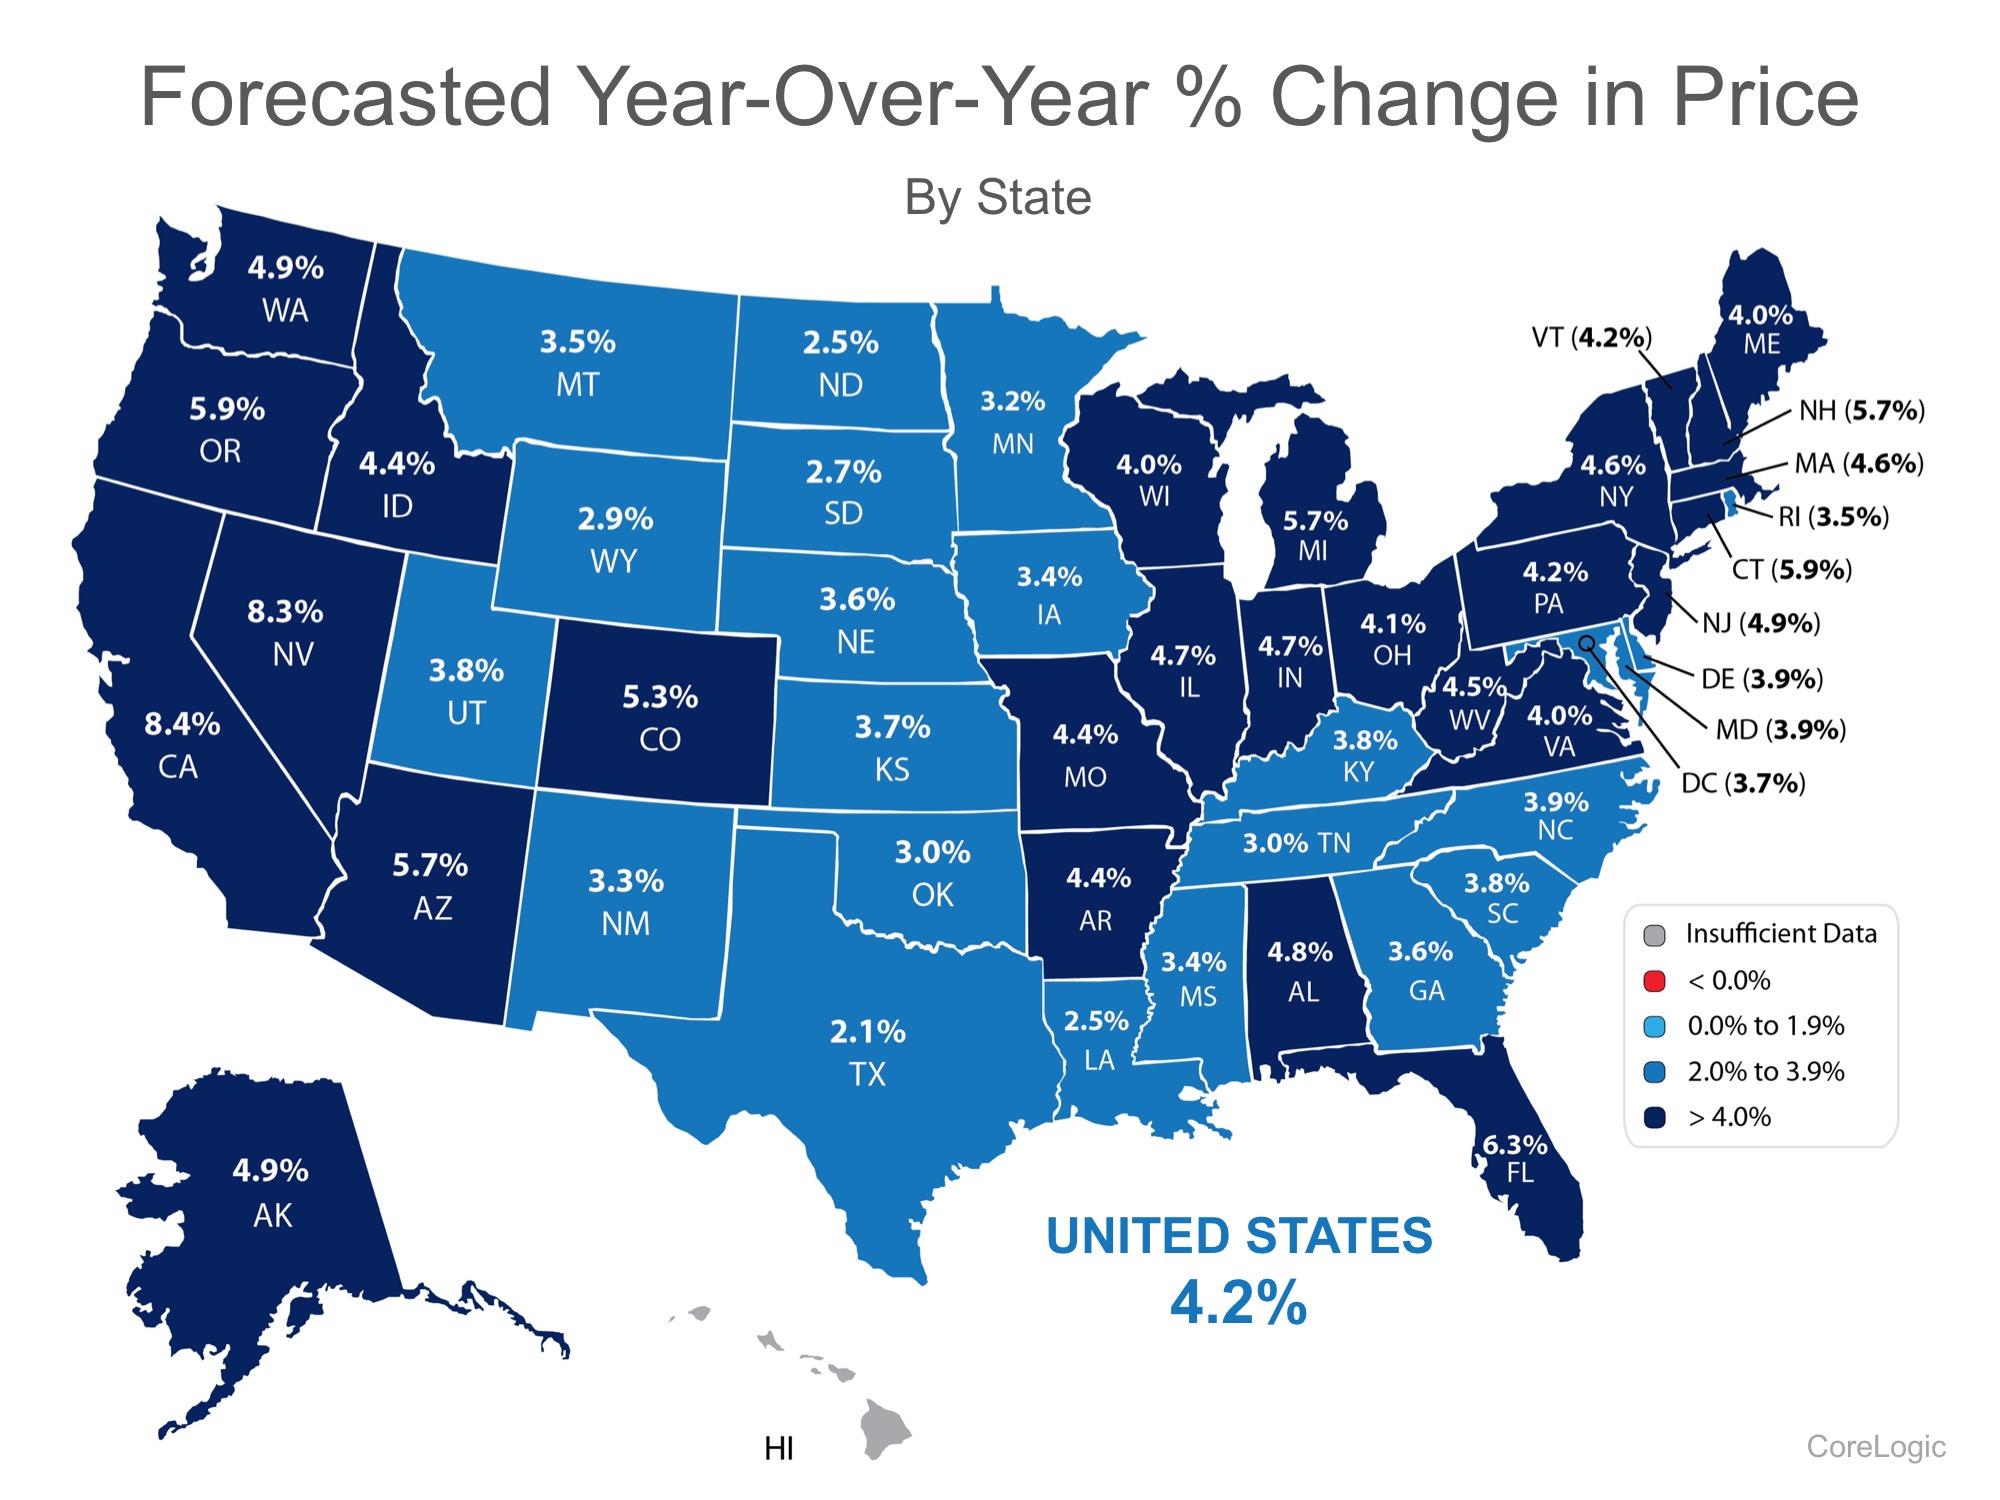
As we can see, CoreLogic projects an increase in home values in 49 of 50 states, and Washington, DC (there was insufficient data for HI). Nationwide, they see home prices increasing by 4.2%.

How might the new tax code impact these numbers?

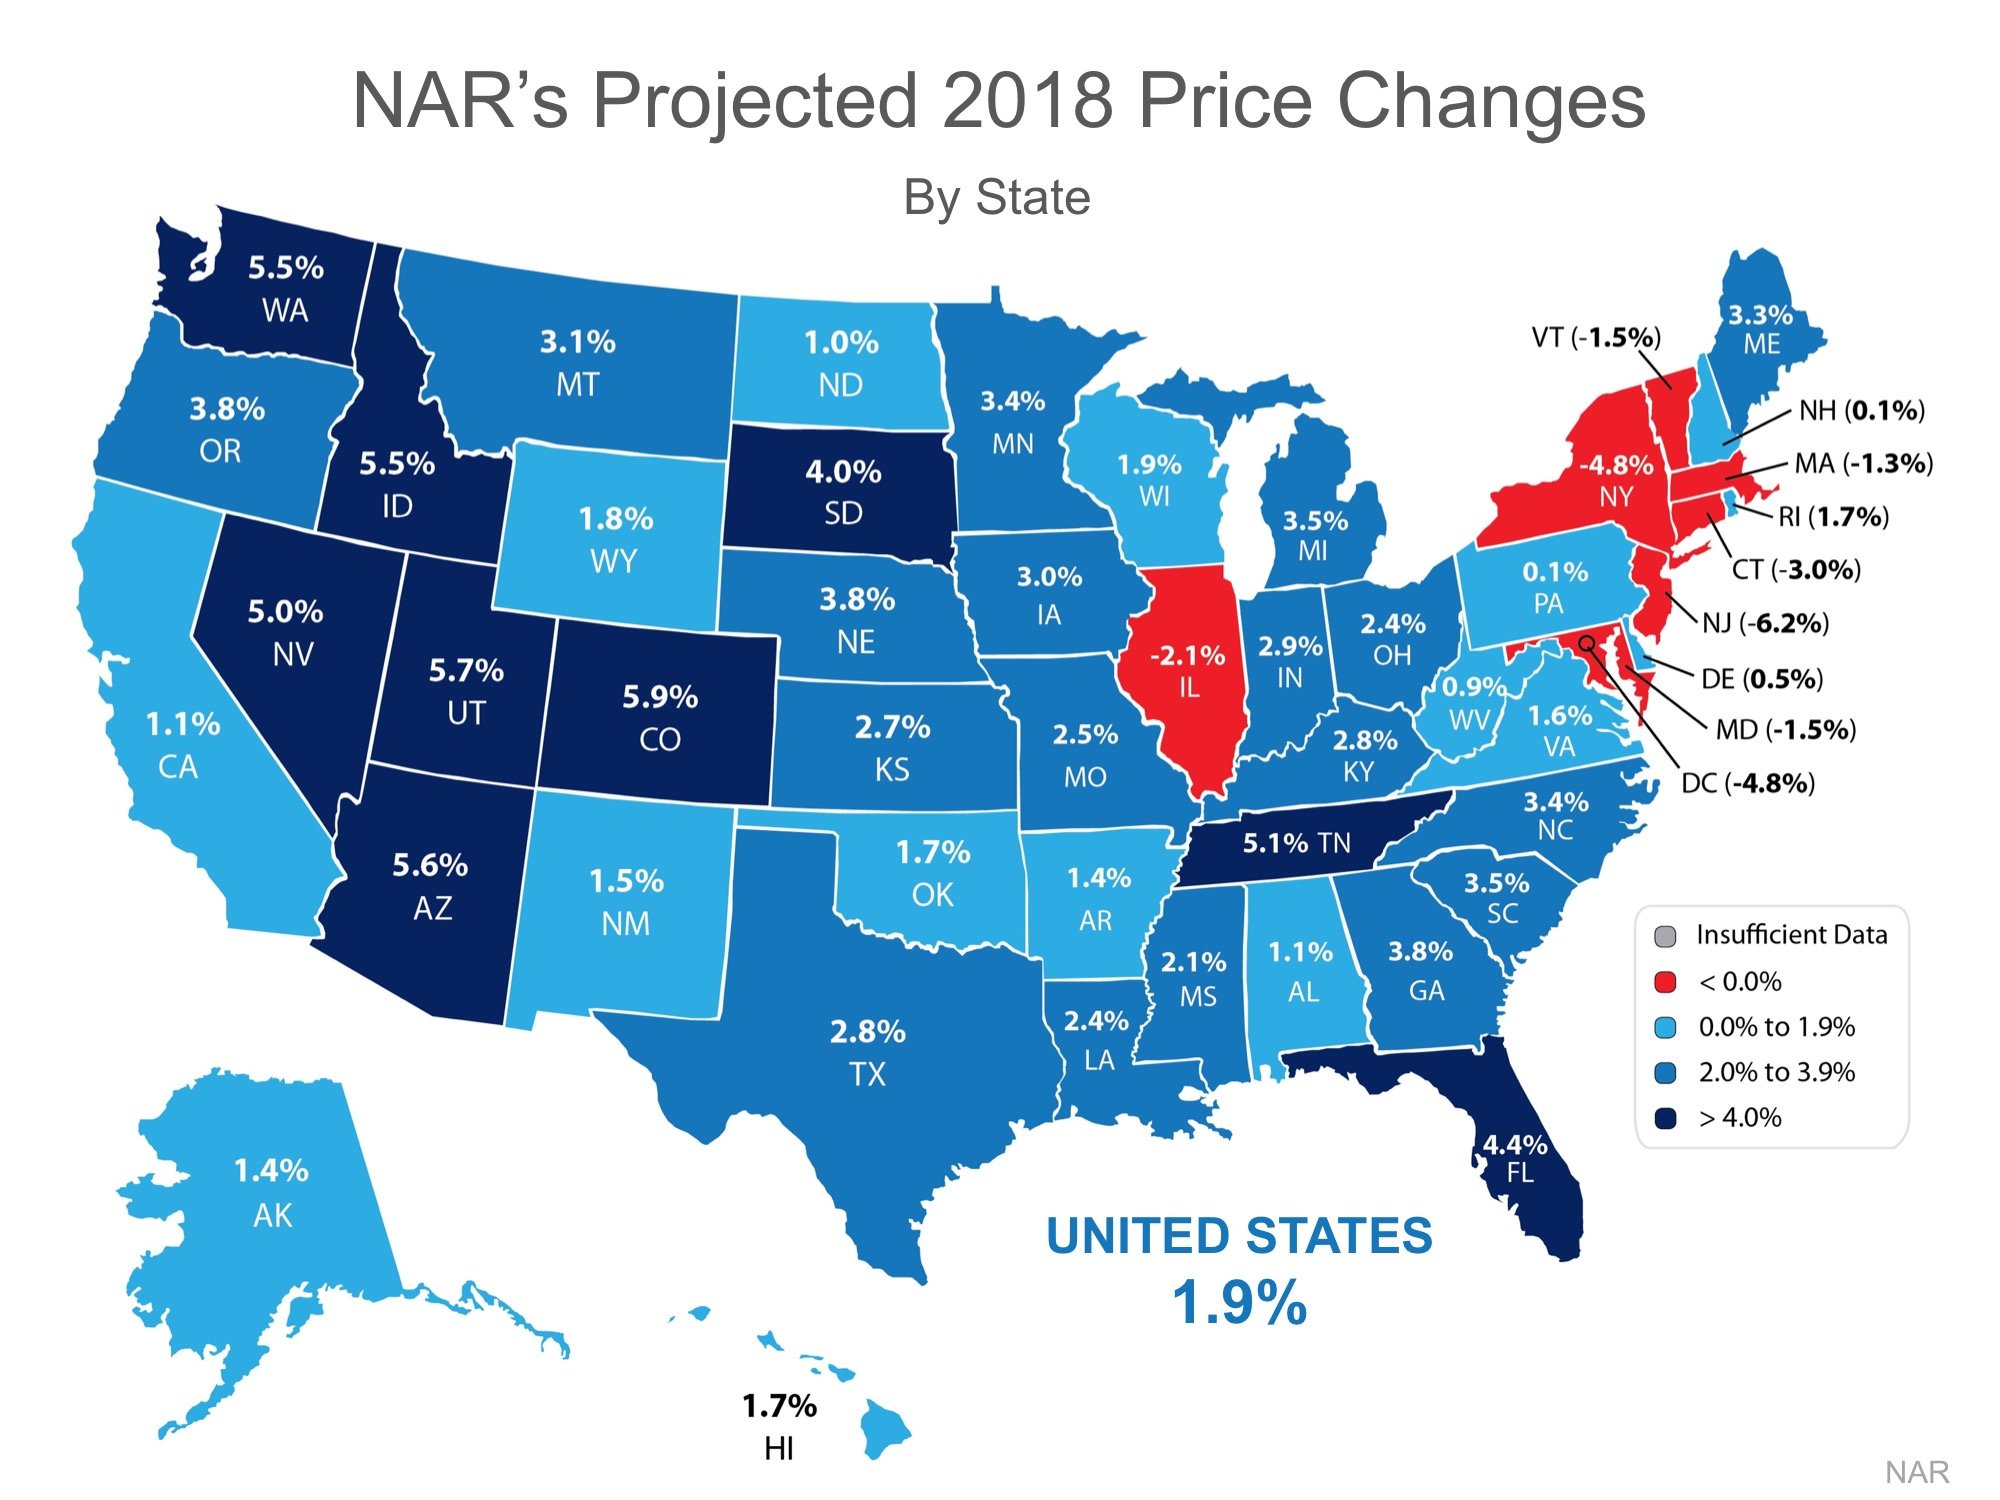
Recently, the National Association of Realtors (NAR) conducted their own analysis to determine the impact the new tax code may have on home values. NAR’s analysis:

“…estimated how home prices will change in the upcoming year for each state, considering the impact of the new tax law and the momentum of jobs and housing inventory.”

Here is a map based on NAR’s analysis:

What Impact Will the New Tax Code Have on Home Values? | Simplifying The Market


Bottom Line

According to NAR, the new tax code will have an impact on home values across the country. However, the effect will be much less significant than what some originally thought.


Get the KCM Blog
Members: Sign in now to set up your Personalized Posts & start sharing today!

Not a Member Yet? Click Here to learn more about KCM’s newest feature, Personalized Posts.

« 61% of First-Time Buyers Put Down Less than 6%
Where Did Americans Move in 2017? [INFOGRAPHIC] »
January 18, 2018/by KCM CREW

Language:

  • English
  • Español


Categories

  • left-column
    • For Buyers
    • For Sellers
    • Infographics
    • Home Prices
    • Mortgage Rates
    • Inventory

  • left-column
    • Overview
      • Daily Blog Posts
      • Social Graphics
      • Videos
      • Buyer & Seller Guides
      • Market Reports & Visuals
      • Email & Newsletter Builder
      • Spanish Content
  • right-column
    • About KCM
      • Success Stories
      • Our Story
      • FAQs
      • News & Press
      • Group Membership
      • Contact
      • Careers

Contact Us

8720 Stony Point Pkwy
Suite 400
Richmond, VA 23235

(631) 787-6200

Email KCM
Copyright © 2026 - Keeping Current Matters | Privacy Policy | Terms of Service
  • Facebook
  • Twitter
  • Instagram
  • Youtube
  • LinkedIn
61% of First-Time Buyers Put Down Less than 6% Where Did Americans Move in 2017? [INFOGRAPHIC]
Scroll to top