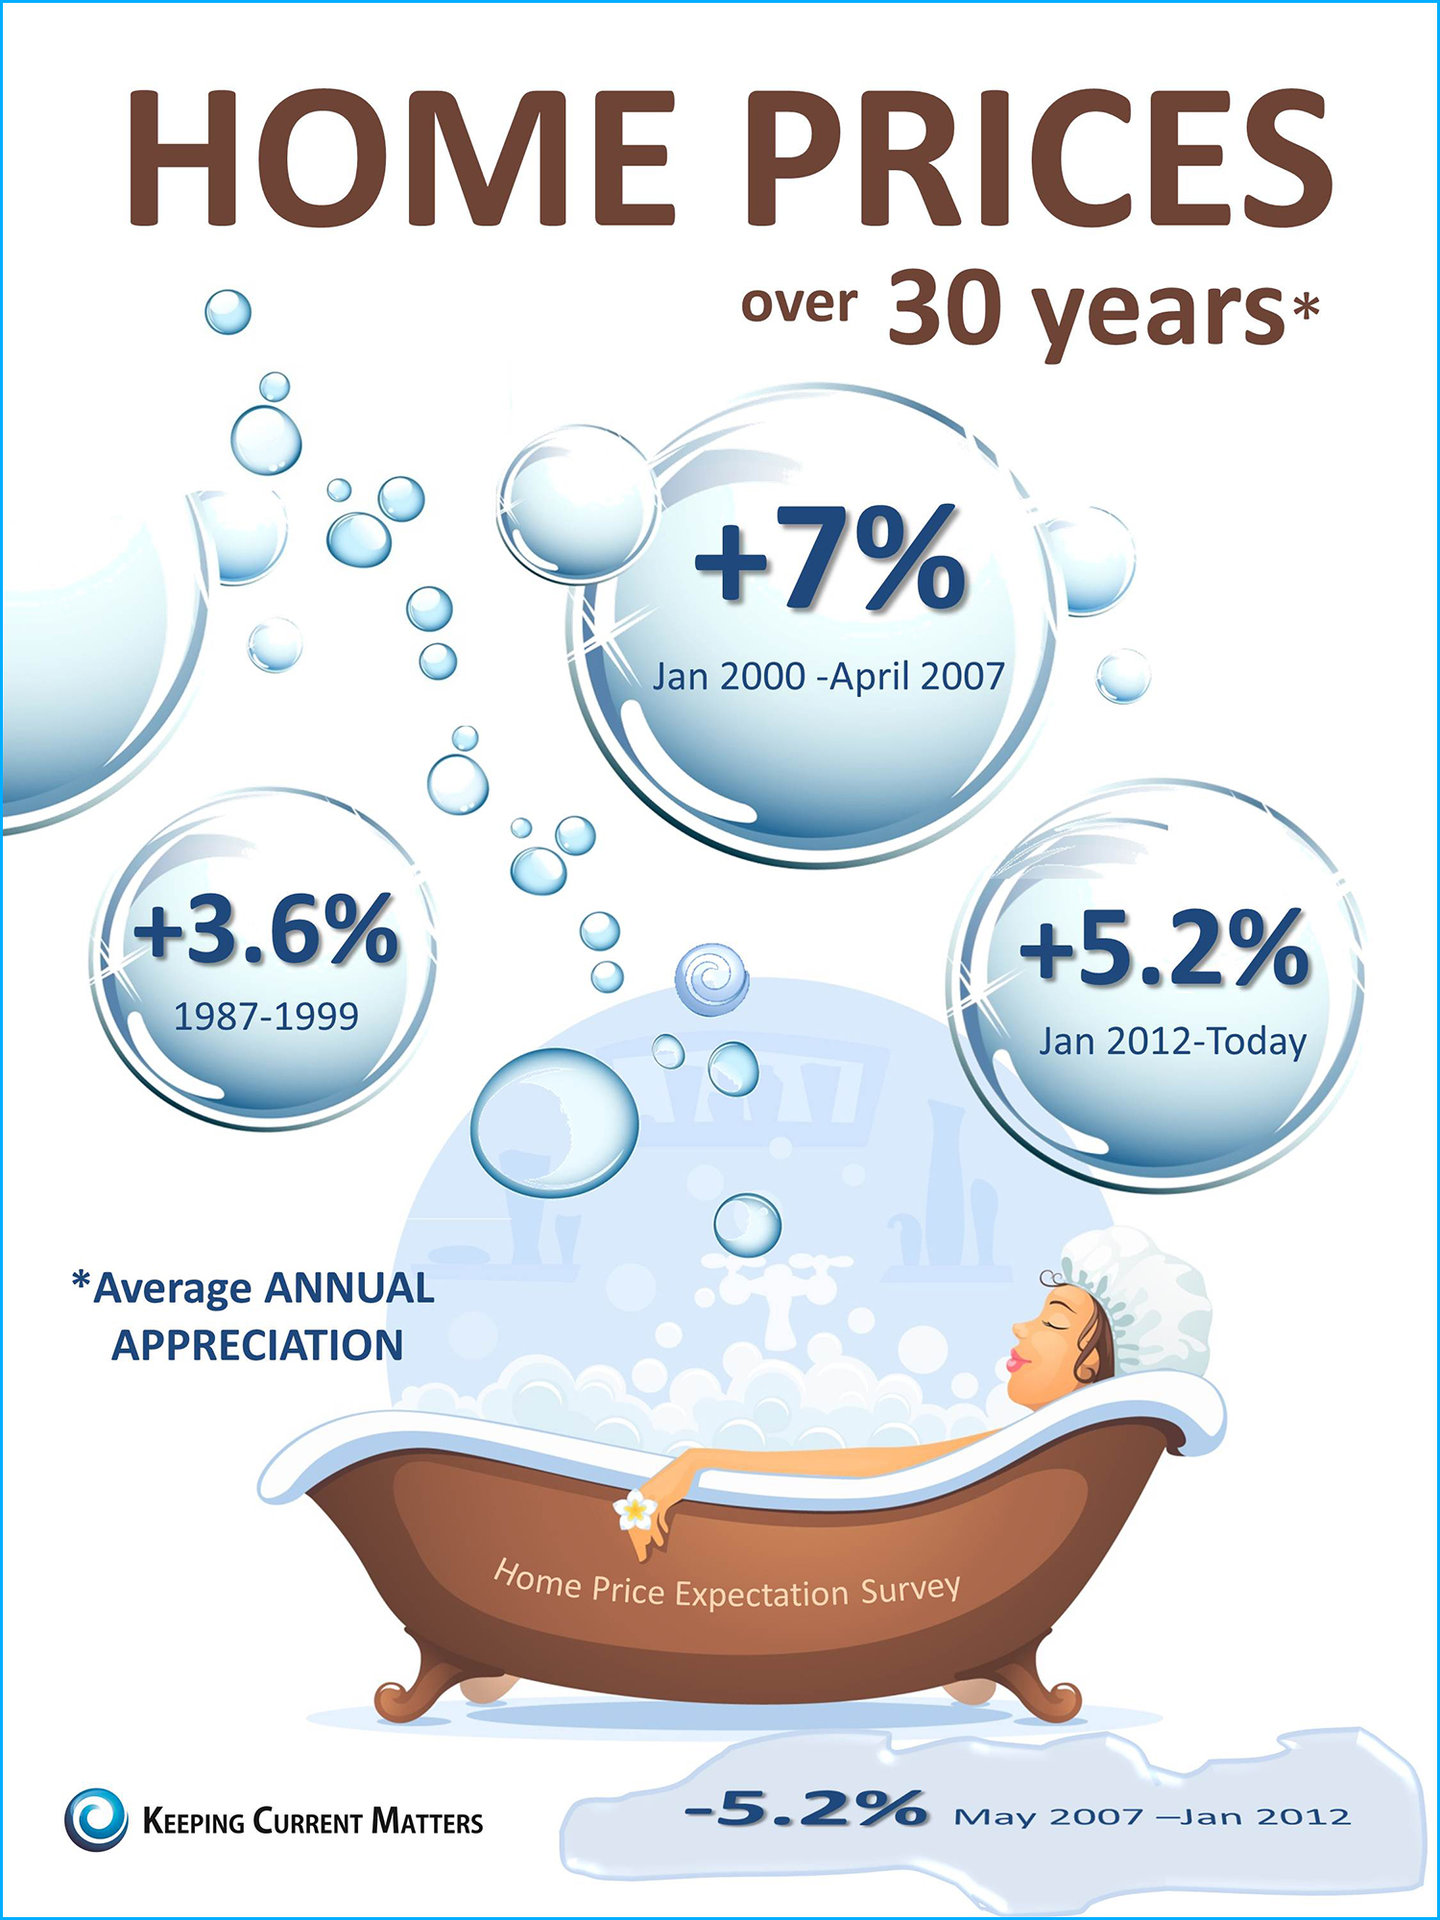
Home Prices over 30 Years [INFOGRAPHIC]
Members: Sign in now to set up your Personalized Posts & start sharing today! Not a Member Yet? Click Here to learn more about KCM’s newest feature, Personalized Posts. |
Members: Sign in now to set up your Personalized Posts & start sharing today! Not a Member Yet? Click Here to learn more about KCM’s newest feature, Personalized Posts. | ![]() |
The Home Prices over 30 Years (May 2007 to Jan 2012) appears as (minus) -5.2%. Did you mean to portray it as a negative number?
Yes… During May 2007 to January 2012 there was negative appreciation (depreciation) in home values.
Hi.. it reads over 30 years but from, as shown, with a starting date of 1987, that less than 30. It makes me questions the other stats stated. Just saying…
Correction acknowledged. We rounded up from 27 years. We didn’t mean to deceive.
I have used this infograph in the past, thanks for updating it, nice work as usual!
Is this compounded? For example $100,000 * 1.07 = $107,000, $107,000 * 1.07 = $114,490, $107,490 * 1.07 = $122,504, etc, etc, etc.
The numbers reflect the ‘average annual’ appreciation/depreciation for the years noted.