Keeping Current Matters
  • Products
    • Social Edge
    • Playbooks
    • RealTalk
  • Market Insights
  • Pricing
  • Blog
  • Login
  • Start a Free Trial
  • Menu Menu
  • English
  • Español
AGENTS: Did you know you can share a personalized version of this post? Learn more!
For Buyers, Home Prices, First-Time Buyers, Move-Up

The Real Reason Home Prices are Increasing

The Real Reason Home Prices are Increasing
  • Facebook
  • Twitter
  • Pinterest
  • LinkedIn

There are many unsubstantiated theories as to why home values are continuing to increase. From those who are worried that lending standards are again becoming too lenient (data shows this is untrue), to those who are concerned that prices are again approaching boom peaks because of “irrational exuberance” (this is also untrue as prices are not at peak levels when they are adjusted for inflation), there seems to be no shortage of opinion.

However, the increase in prices is easily explained by the theory of supply & demand. Whenever there is a limited supply of an item that is in high demand, prices increase.

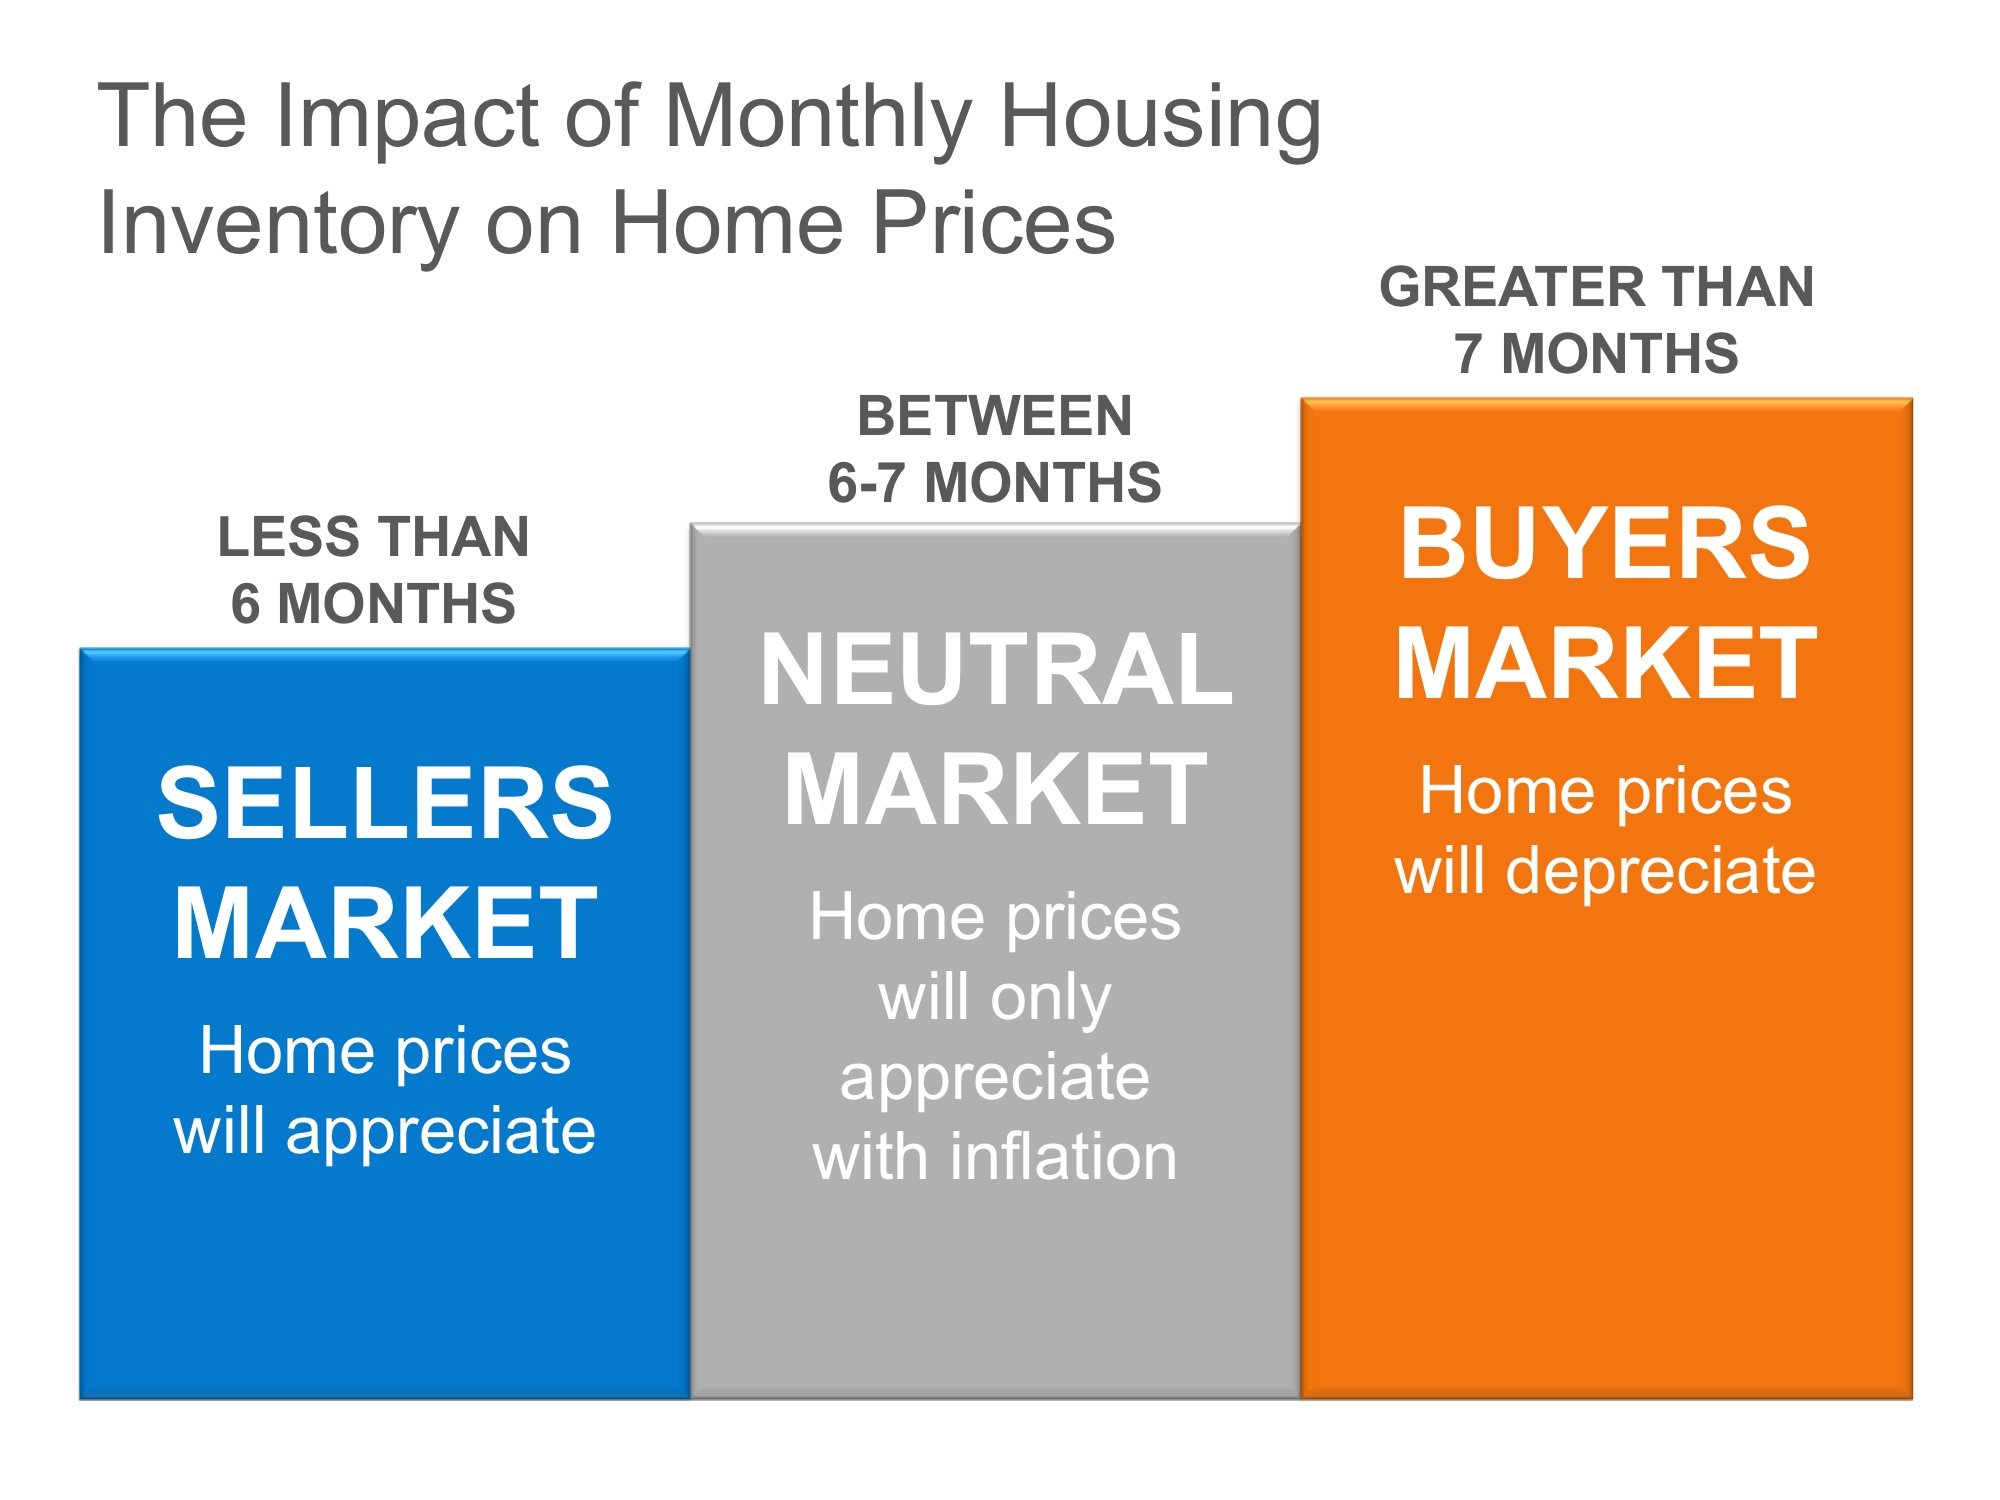
It is that simple. In real estate, it takes a six-month supply of existing salable inventory to maintain pricing stability. In most housing markets, anything less than six months will cause home values to appreciate and anything more than seven months will cause prices to depreciate (see chart 1).

The Real Reason Home Prices are Increasing | Simplifying The Market

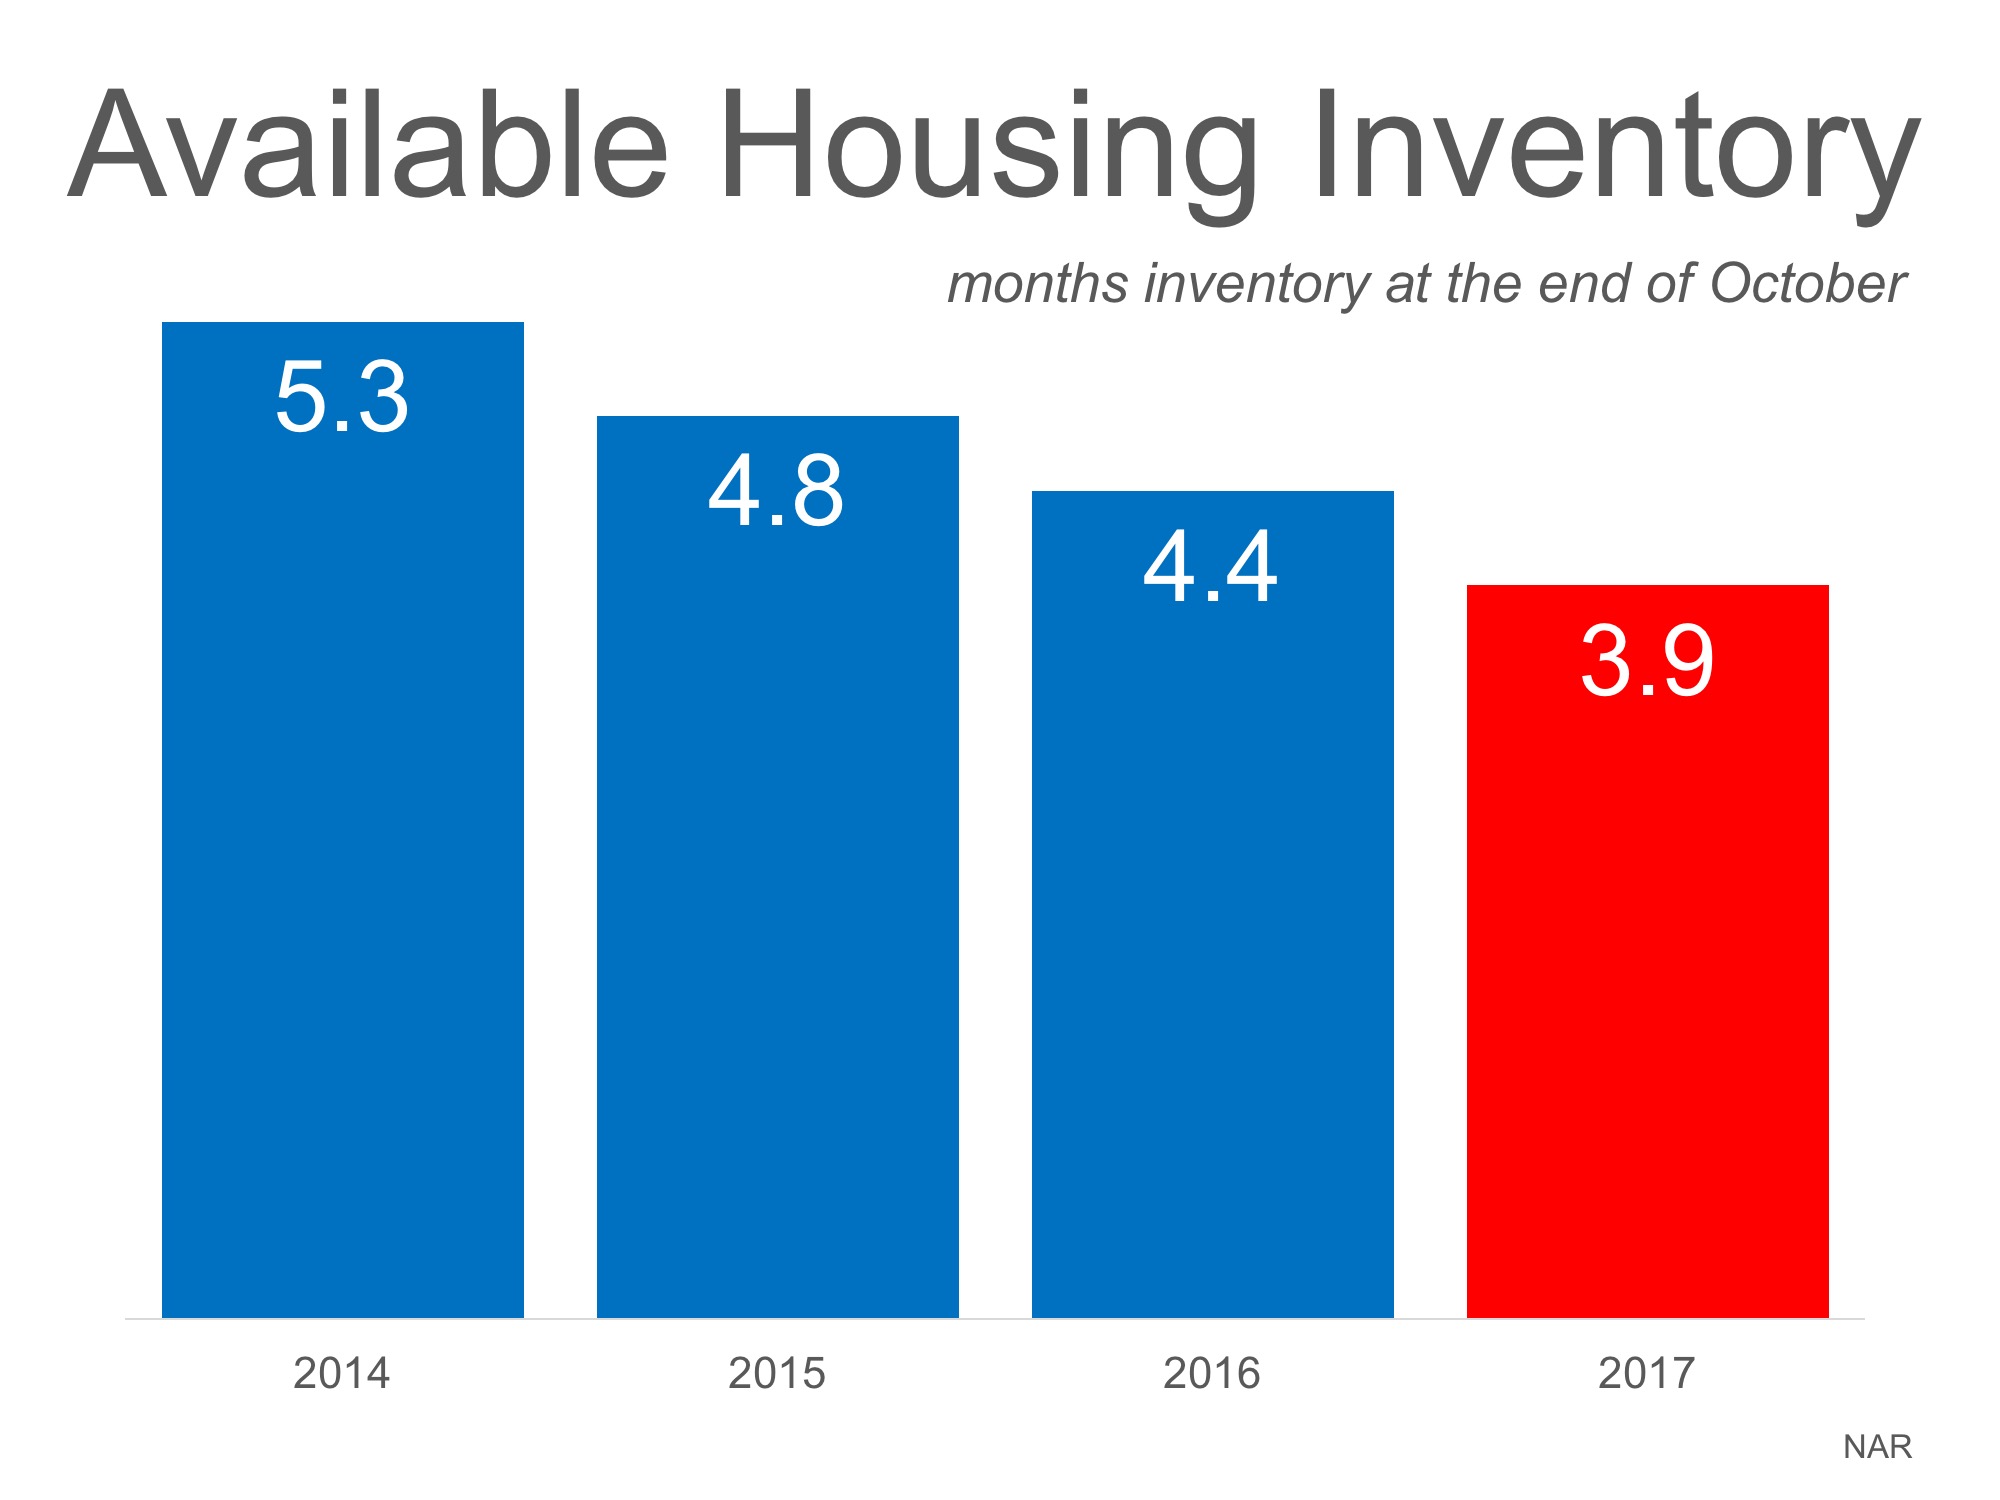
According to the Existing Home Sales Report from the National Association of Realtors (NAR), the monthly inventory of homes has been below six months for the last four years (see chart 2).

The Real Reason Home Prices are Increasing | Simplifying The Market

Bottom Line

If buyer demand outpaces the current supply of existing homes for sale, prices will continue to appreciate. Nothing nefarious is taking place. It is simply the theory of supply & demand working as it should.


Get the KCM Blog
Members: Sign in now to set up your Personalized Posts & start sharing today!

Not a Member Yet? Click Here to learn more about KCM’s newest feature, Personalized Posts.

« 2 Charts That Show the Truth about Home Affordability
Median Days on the Market Drops to 34! [INFOGRAPHIC] »
November 30, 2017/by KCM CREW

Language:

  • English
  • Español


Categories

  • left-column
    • For Buyers
    • For Sellers
    • Infographics
    • Home Prices
    • Mortgage Rates
    • Inventory

  • left-column
    • Overview
      • Daily Blog Posts
      • Social Graphics
      • Videos
      • Buyer & Seller Guides
      • Market Reports & Visuals
      • Email & Newsletter Builder
      • Spanish Content
  • right-column
    • About KCM
      • Success Stories
      • Our Story
      • FAQs
      • News & Press
      • Group Membership
      • Contact
      • Careers

Contact Us

8720 Stony Point Pkwy
Suite 400
Richmond, VA 23235

(631) 787-6200

Email KCM
Copyright © 2026 - Keeping Current Matters | Privacy Policy | Terms of Service
  • Facebook
  • Twitter
  • Instagram
  • Youtube
  • LinkedIn
2 Charts That Show the Truth about Home Affordability Median Days on the Market Drops to 34! [INFOGRAPHIC]
Scroll to top