
Further Proof This Isn’t a Housing Bubble

Two weeks ago, we posted a blog which explained that current increases in home prices were the result of the well-known concept of supply & demand and should not lead to conversations of a new housing bubble. Today, we want to look at home prices as compared to current incomes.
Here is a graph showing the monthly mortgage payment on a median priced home in the U.S. over the last 25 years:
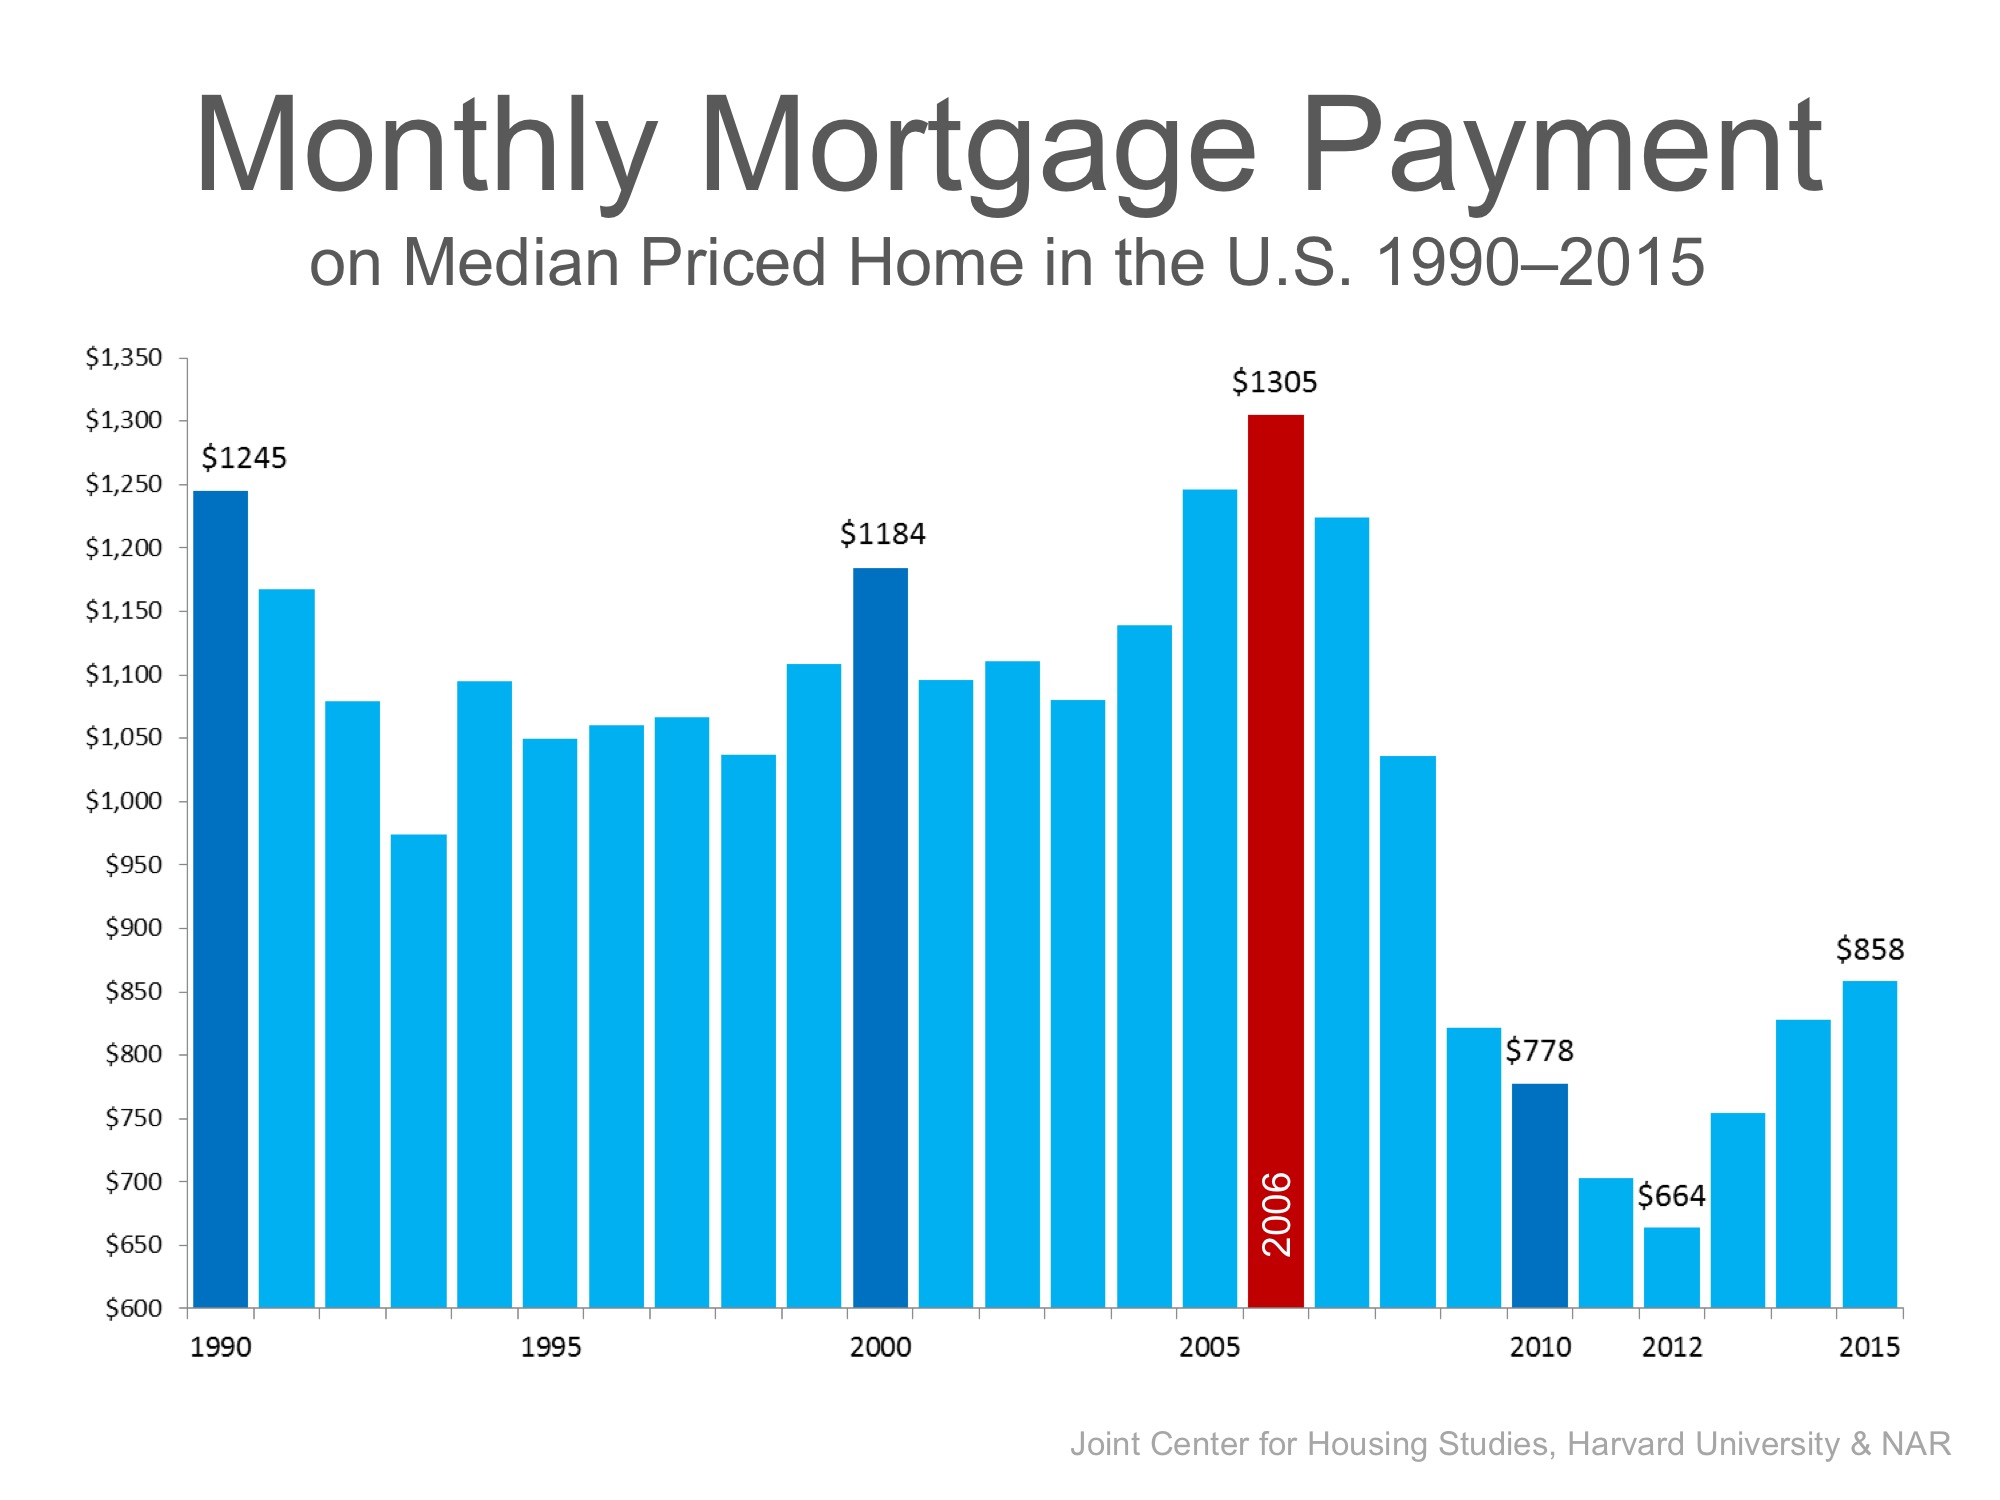
Mortgage payments are currently well below the historic average over that time period. Purchasers are not overextending themselves to buy a home like they did on the run-up to the housing crash.
Lawrence Yun, the Chief Economist at the National Association of Realtors, recently explained in a Forbes article:
“Even though home prices are climbing far above people’s income, exceptionally low mortgage rates have permitted people to buy a home without overstretching their budget. For someone making a 20% down payment, the monthly mortgage payment at today’s mortgage rates would take up 15% of a person’s gross income. During the bubble years, it was reaching 25% of income. The long-term historical average is around 20%. Therefore, a middle-income household does not need to overstretch their budget much if at all to buy a typical home.”
Bottom Line
Due to low interest rates, demand for housing has dramatically increased. This has caused a jump in home prices. However, low interest rates have also allowed the monthly cost of buying a home to remain well below historic norms. We are in a strong housing market, not a housing bubble.

|
Members: Sign in now to set up your Personalized Posts & start sharing today!
Not a Member Yet? Click Here to learn more about KCM’s newest feature, Personalized Posts. |