
A Recession Does Not Equal a Housing Crisis [INFOGRAPHIC]
Some Highlights
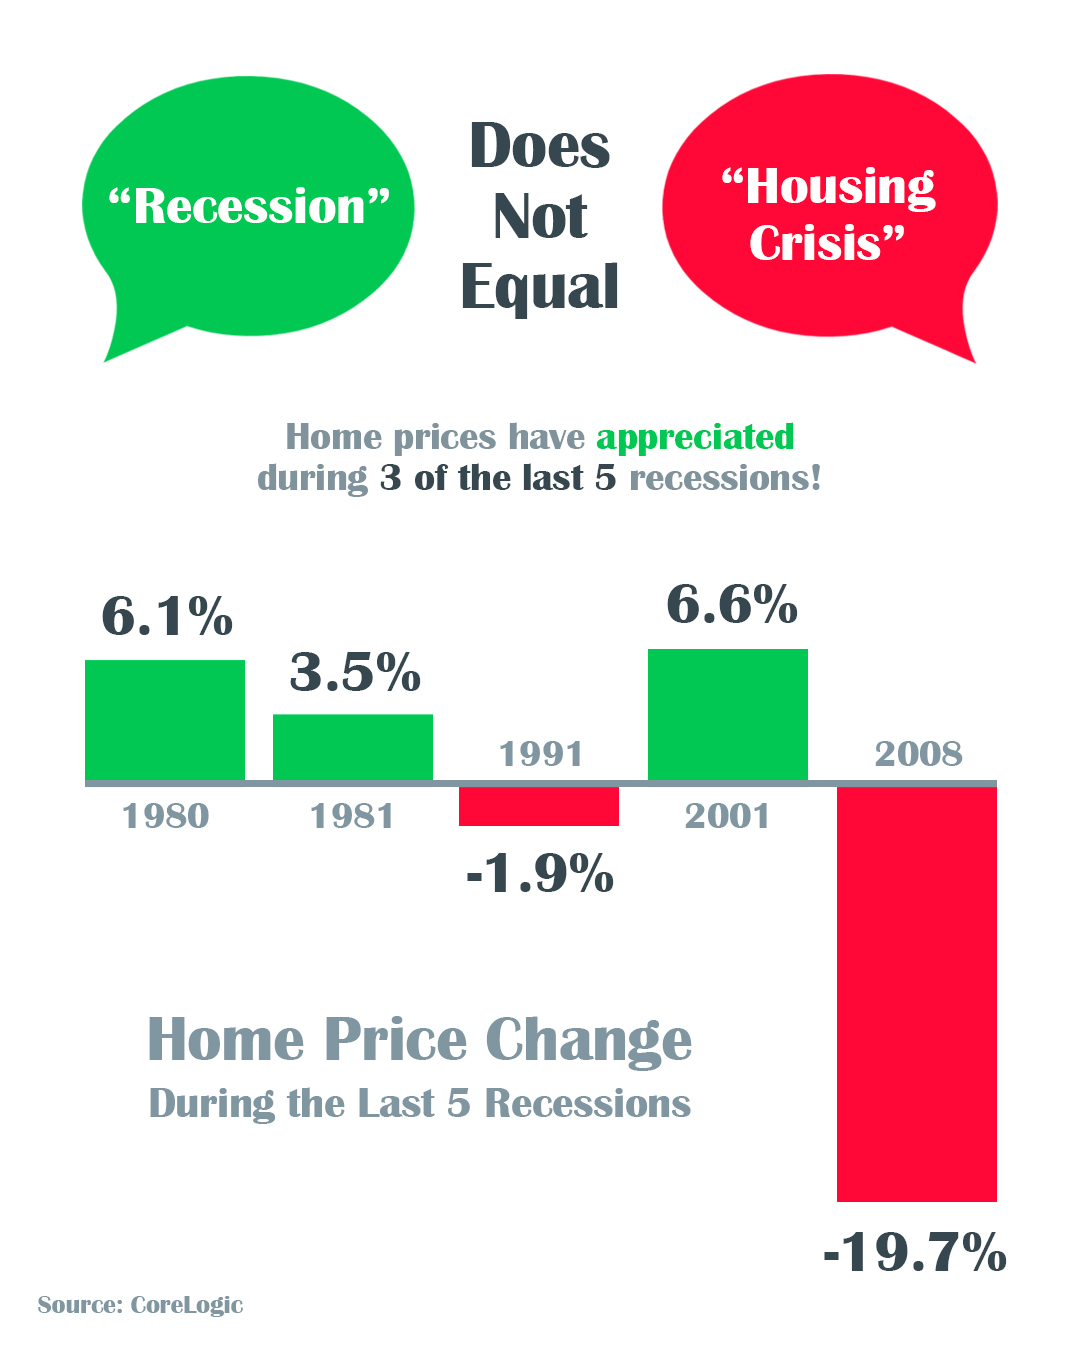
- The COVID-19 pandemic is causing an economic slowdown.
- The good news is, home values actually increased in 3 of the last 5 U.S. recessions and decreased by less than 2% in the 4th.
- All things considered, an economic slowdown does not equal a housing crisis, and this will not be a repeat of 2008.
![Buying a Home: Do You Know the Lingo? [INFOGRAPHIC] | Simplifying The Market](https://files.keepingcurrentmatters.com/wp-content/uploads/2020/03/20200313-MEM-EN.jpg)
![The Difference an Hour Makes [INFOGRAPHIC] | Simplifying The Market](https://files.keepingcurrentmatters.com/wp-content/uploads/2020/03/20200306-MEM-EN.jpg)
![10 Steps to Buying a Home [INFOGRAPHIC] | Keeping Current Matters](https://files.keepingcurrentmatters.com/wp-content/uploads/2020/02/20200228-MEM-EN.jpg)
![Interest Rates Over Time [INFOGRAPHIC] | Simplifying The Market](https://files.keepingcurrentmatters.com/wp-content/uploads/2020/02/20200221-MEM.jpg)
![Top Reasons to Love Homeownership [INFOGRAPHIC] | Simplifying The Market](https://files.keepingcurrentmatters.com/wp-content/uploads/2020/02/Member-Feb-Infographic-01-ENG.jpg)
![The Top States Americans Moved to Last Year [INFOGRAPHIC] | Simplifying The Market](https://files.keepingcurrentmatters.com/wp-content/uploads/2020/02/20200207-MEM-scaled.jpg)
![5 Reasons Homeowners Throw Better Parties During the Big Game [INFOGRAPHIC] | Simplifying The Market](https://files.keepingcurrentmatters.com/wp-content/uploads/2020/01/20200131-MEM.jpg)
![2020 Homebuying Checklist [INFOGRAPHIC] | Simplifying The Market](https://files.keepingcurrentmatters.com/wp-content/uploads/2020/01/20200124-MEM.jpg)
![Where Homebuyers Are Heading By Generation [INFOGRAPHIC] | Simplifying The Market](https://files.keepingcurrentmatters.com/wp-content/uploads/2020/01/20200117-MEM-1-scaled.jpg)
![National Cut Your Energy Costs Day [INFOGRAPHIC] | Simplifying The Market](https://files.keepingcurrentmatters.com/wp-content/uploads/2020/01/20200110-MEM.jpg)
![Top Renovations for Maximum ROI [INFOGRAPHIC] | Simplifying The Market](https://files.keepingcurrentmatters.com/wp-content/uploads/2019/12/20200103-MEM-scaled.jpg)
![Working with a Local Real Estate Professional Makes All the Difference [INFOGRAPHIC] | Simplifying The Market](https://files.keepingcurrentmatters.com/wp-content/uploads/2019/12/20191227-MEM.jpg)
![Where is the Housing Market Headed in 2020? [INFOGRAPHIC] | Simplifying The Market](https://files.keepingcurrentmatters.com/wp-content/uploads/2019/12/20191220-MEM-scaled.jpg)
![Get Your House Ready To Sell This Winter [INFOGRAPHIC] | Simplifying The Market](https://files.keepingcurrentmatters.com/wp-content/uploads/2019/12/20191213-MEM-ENG.jpg)
![Is Your First Home Now Within Your Grasp? [INFOGRAPHIC] | Simplifying the Market](https://files.keepingcurrentmatters.com/wp-content/uploads/2019/12/20191206-MEM-scaled.jpg)
![Buyers Are Looking For Your Home [INFOGRAPHIC] | Simplifying The Market](https://files.keepingcurrentmatters.com/wp-content/uploads/2019/11/20191129-MEM-ENG-scaled.jpg)
![The Cost Across Time [INFOGRAPHIC] | Simplifying The Market](https://files.keepingcurrentmatters.com/wp-content/uploads/2019/11/20191122-MEM.jpg)
![The Cost of Renting vs. Buying a Home [INFOGRAPHIC] | Simplifying The Market](https://files.keepingcurrentmatters.com/wp-content/uploads/2019/11/20191115-MEM-ENG.jpg)
![VA Home Loans by the Numbers [INFOGRAPHIC] | Simplifying The Market](https://files.keepingcurrentmatters.com/wp-content/uploads/2019/11/20191108-MEM.jpg)
![The Difference an Hour Will Make This Fall [INFOGRAPHIC] | Simplifying The Market](https://files.keepingcurrentmatters.com/wp-content/uploads/2019/10/20191101-MEM.jpg)
![Buying a home can be SCARY…Until you know the FACTS [INFOGRAPHIC] | Simplifying The Market](https://files.keepingcurrentmatters.com/wp-content/uploads/2019/10/20191025-MEM.jpg)
![Homes Are Selling Quickly [INFOGRAPHIC] | Simplifying The Market](https://files.keepingcurrentmatters.com/wp-content/uploads/2019/10/20191018-MEM-1.jpg)
![What You Need to Know About the Mortgage Process [INFOGRAPHIC] | Simplifying The Market](https://files.keepingcurrentmatters.com/wp-content/uploads/2019/10/20191011-MEM.jpg)
![5 Homebuying Acronyms You Need to Know [INFOGRAPHIC] | Simplifying The Market](https://files.keepingcurrentmatters.com/wp-content/uploads/2019/10/20191004-MEM.jpg)