Foreclosure Rate Drops to Pre-Crisis Levels [INFOGRAPHIC]
![Foreclosure Rate Drops to Pre-Crisis Levels [INFOGRAPHIC] | Simplifying The Market](https://files.keepingcurrentmatters.com/wp-content/uploads/2016/09/Corelogic-Foreclosure-STM.jpg)
Some Highlights:
- Only 2.9% of homes are in serious delinquency, down 17.1% from July 2015.
- This is the 57th consecutive month with a year-over-year decline.
- The national foreclosure rate has returned to August 2007 levels, at only 0.9%.

![50% of Houses sold in 36 Days or Less in July [INFOGRAPHIC] | Simplifying The Market](https://files.keepingcurrentmatters.com/wp-content/uploads/2016/09/20160916-STM-ENG.jpg)
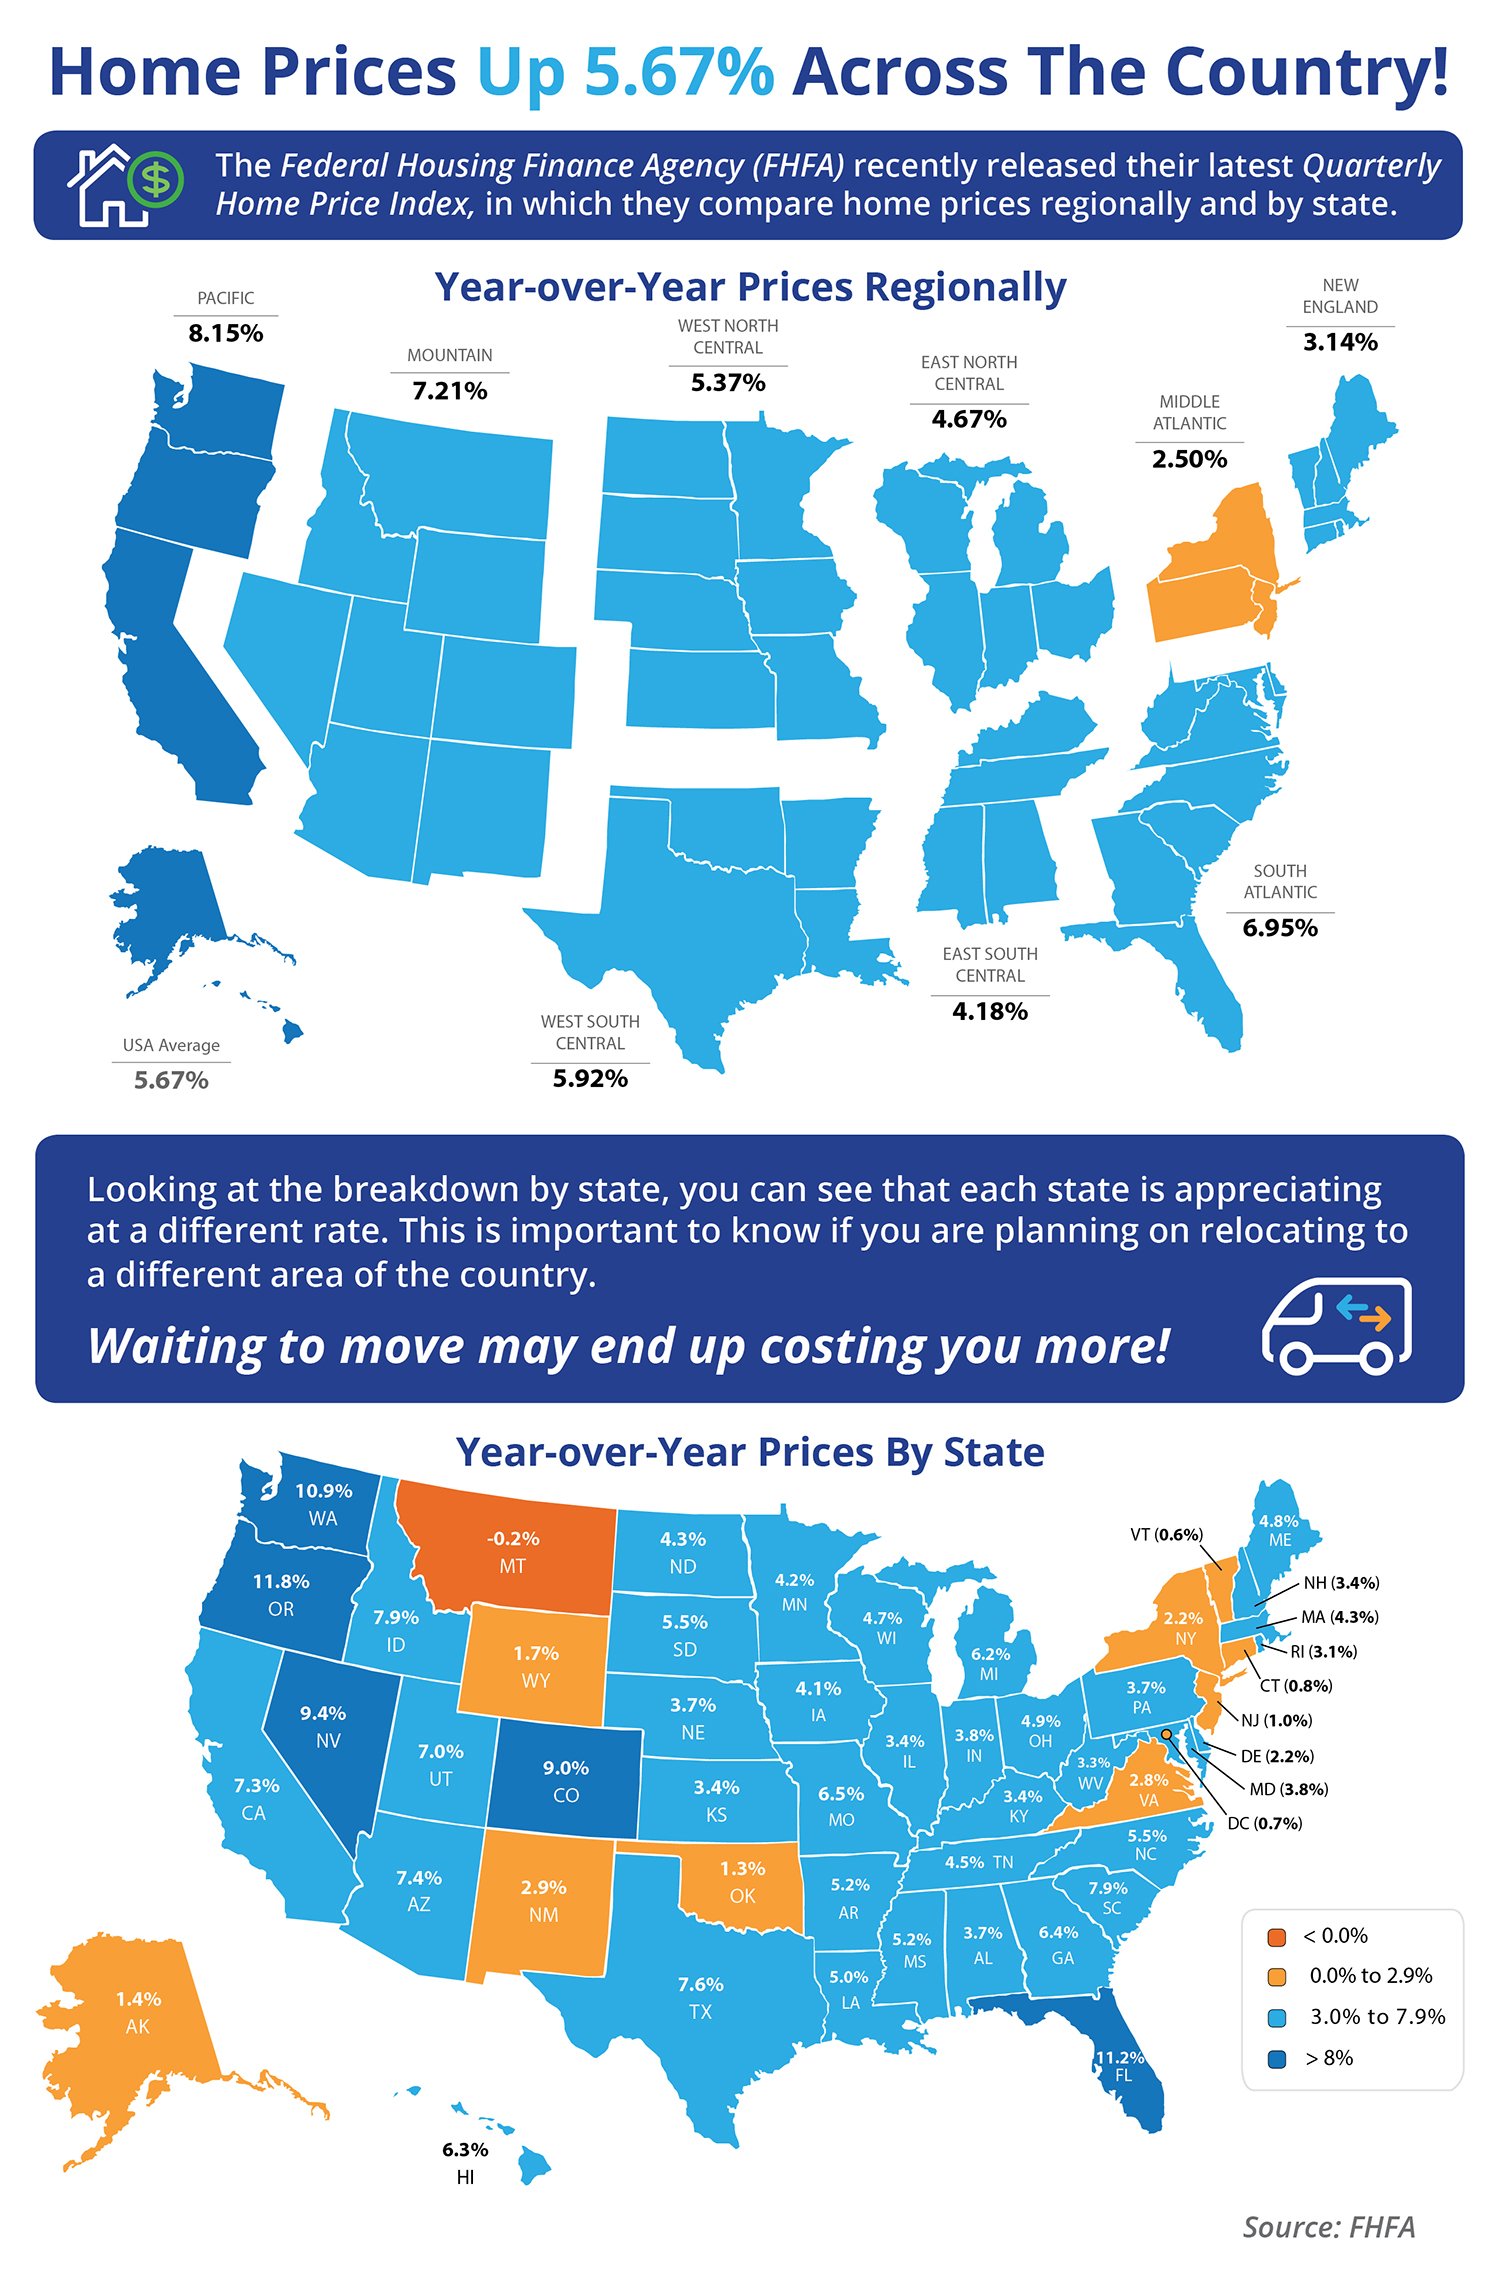
![Home Prices Up 5.61% Across The Country! [INFOGRAPHIC] | Simplifying The Market](https://files.keepingcurrentmatters.com/wp-content/uploads/2016/09/20160909-STM-ENG.jpg)
![Want to Get an A? Hire A Real Estate Pro [INFOGRAPHIC] | Simplifying The Market](https://files.keepingcurrentmatters.com/wp-content/uploads/2016/08/A-Reasons-To-Use-A-RE-Pro-STM.jpg)
![How Supply & Demand Impacts the Real Estate Market [INFOGRAPHIC] | Simplifying The Market](https://files.keepingcurrentmatters.com/wp-content/uploads/2016/08/201660826-STM-ENG.jpg)
![‘Old Millennials’ Are Diving Head-First into Homeownership [INFOGRAPHIC] | Simplifying The Market](https://files.keepingcurrentmatters.com/wp-content/uploads/2016/08/Old-Millennials-ENG-STM.jpg)
![What States Give You the Most ‘Bang for Your Buck’? [INFOGRAPHIC] | Simplifying The Market](https://files.keepingcurrentmatters.com/wp-content/uploads/2016/08/20160812-100-Gets-You-STM.jpg)
![Do You Know the Impact Your Interest Rate Makes? [INFOGRAPHIC] | Simplifying The Market](https://files.keepingcurrentmatters.com/wp-content/uploads/2016/08/20150805-Cost-of-Interest-STM.jpg)
![Home Sales Accelerate During The “Dog Days of Summer” [INFOGRAPHIC] | Simplifying The Market](https://files.keepingcurrentmatters.com/wp-content/uploads/2016/07/20160729-Dog-Days-of-Summer-STM.jpg)
![Slaying Myths About Home Buying [INFOGRAPHIC] | Simplifying The Market](https://files.keepingcurrentmatters.com/wp-content/uploads/2016/07/Slaying-Myths-STM-1.jpg) Some Highlights:
Some Highlights:
![Should I Wait Until Next Year? Or Buy Now? [INFOGRAPHIC] | Simplifying The Market](https://files.keepingcurrentmatters.com/wp-content/uploads/2016/07/Cost-of-Waiting-STM.jpg)
![Saving To Buy A Home? What Would You Sacrifice? [INFOGRAPHIC] | Simplifying The Market](https://files.keepingcurrentmatters.com/wp-content/uploads/2016/07/Sacrifices-to-Buy-BOA-STM.jpg)
![Sales at Highest Pace in 9 Years [INFOGRAPHIC] | Simplifying The Market](https://files.keepingcurrentmatters.com/wp-content/uploads/2016/06/Sales-Highest-in-9-Years-STM-.jpg)
![Thinking You Should FSBO? Think Again [INFOGRAPHIC] | Simplifying The Market](https://files.keepingcurrentmatters.com/wp-content/uploads/2016/06/20160624-ENG-STM.jpg) Some Highlights:
According to NAR's Profile of Home Buyers & Sellers:
Some Highlights:
According to NAR's Profile of Home Buyers & Sellers:
![Foreclosure Rate Drops to New Post-Crisis Low [INFOGRAPHIC] | Simplifying The Market](https://files.keepingcurrentmatters.com/wp-content/uploads/2016/06/Corelogic-Foreclosure-STM.jpg)


![New & Existing Home Sales Climb [INFOGRAPHIC] | Simplifying The Market](https://files.keepingcurrentmatters.com/wp-content/uploads/2016/05/20160527-EHS-APR-STM.jpg)
![Renting vs. Buying: What Does it Really Cost? [INFOGRAPHIC] | Simplifying The Market](https://files.keepingcurrentmatters.com/wp-content/uploads/2016/05/Rent-vs.-Buy-STM.jpg)
![Housing Market Snapshot [INFOGRAPHIC] | Simplifying The Market](https://files.keepingcurrentmatters.com/wp-content/uploads/2016/05/Housing-Market-Update-STM.jpg)


![New Home Buyers Look For Green Options [INFOGRAPHIC] | Simplifying The Market](https://files.keepingcurrentmatters.com/wp-content/uploads/2016/04/Go-Green-Infographic-STM.jpg)
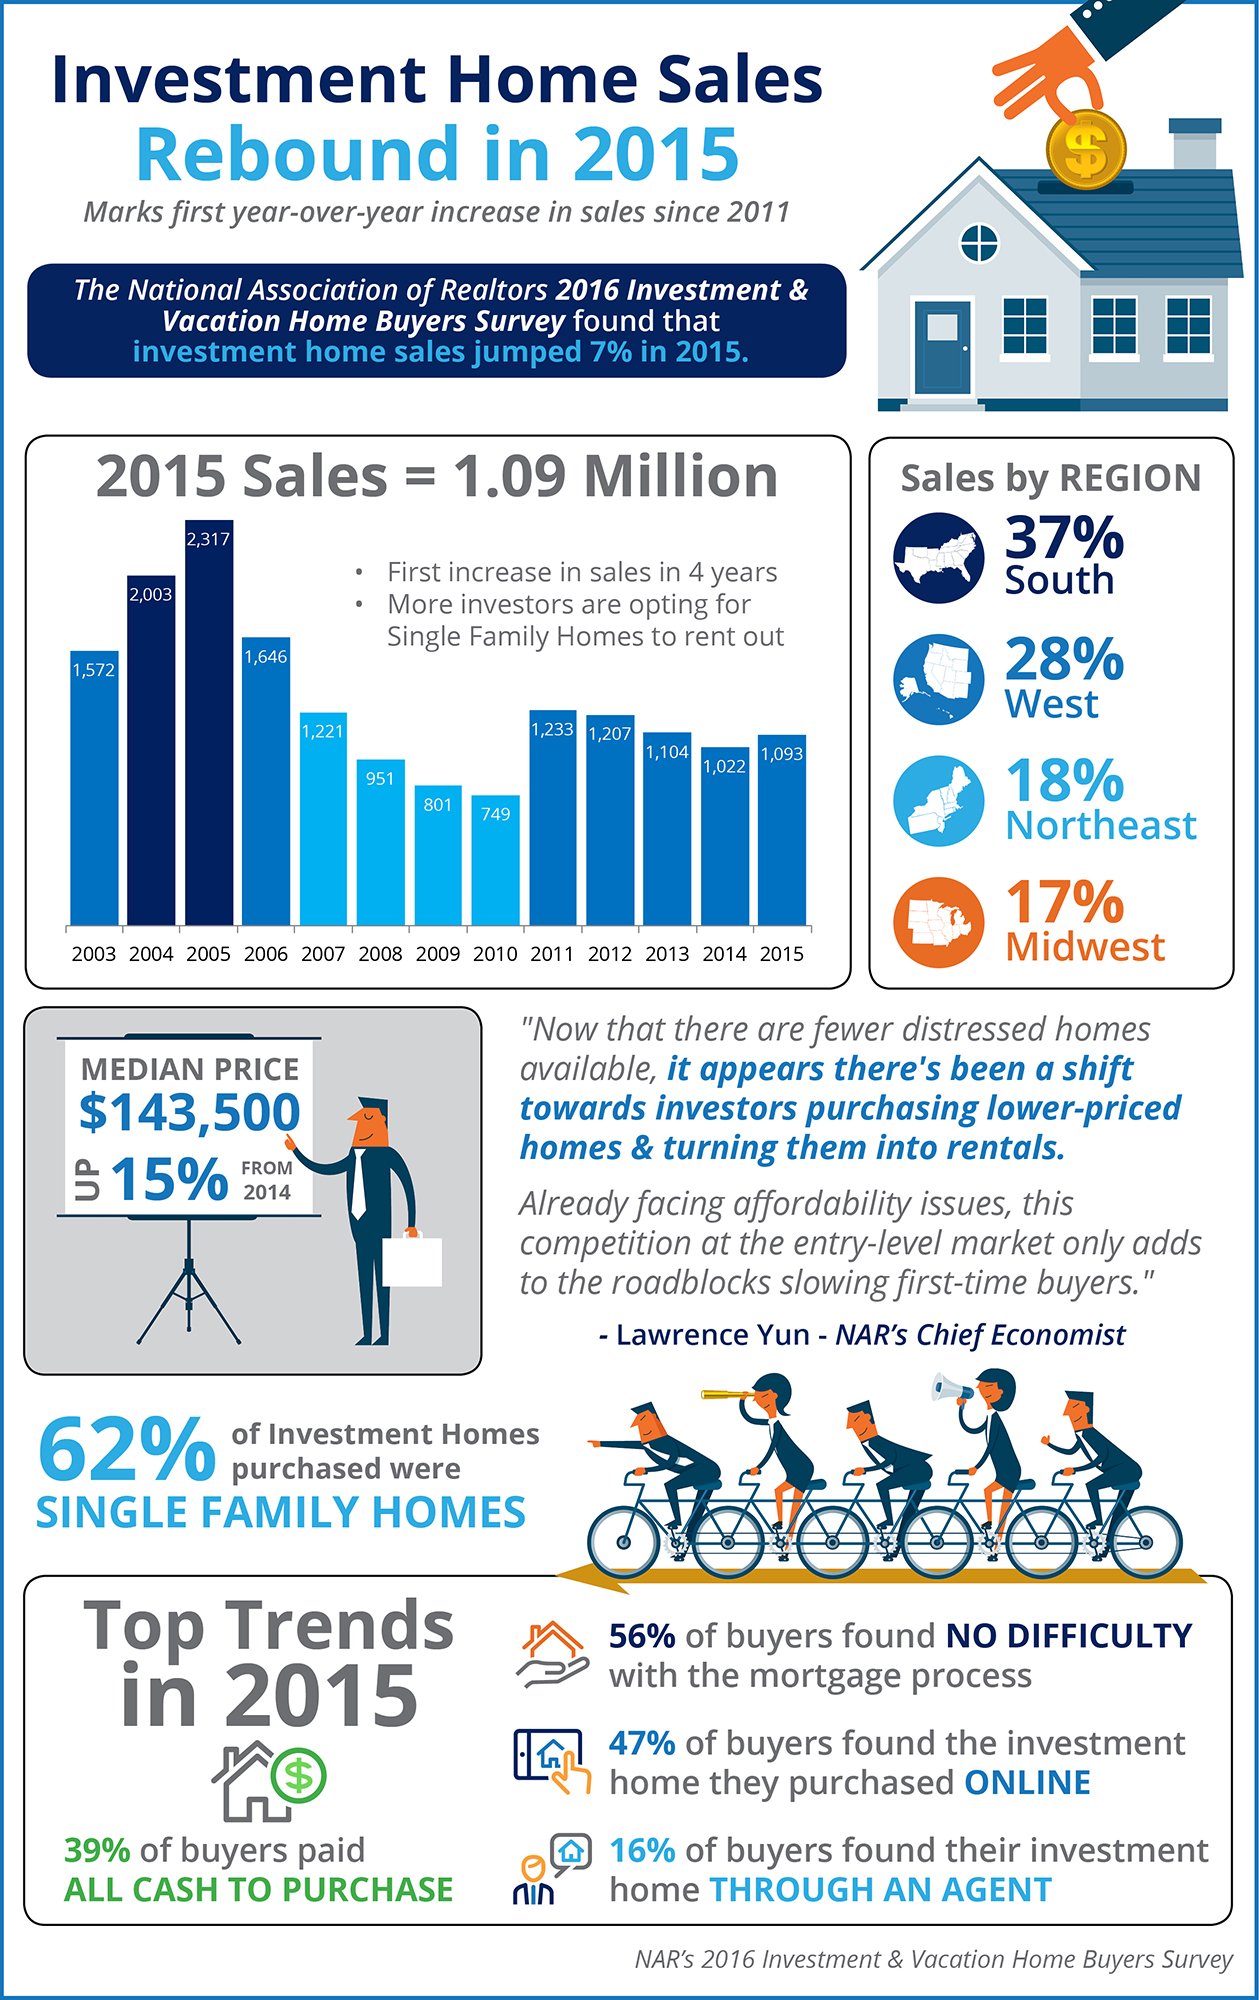
![Vacation Home Sales Reach 2nd Highest Mark Since 2006 [INFOGRAPHIC] | Simplifying The Market](https://files.keepingcurrentmatters.com/wp-content/uploads/2016/04/Vacation-Homes-STM.jpg)

