AGENTS: Did you know you can share a
personalized version of this post?
Learn more!
https://www.keepingcurrentmatters.com/2014/08/08/home-prices-since-peak-infographic/https%3A%2F%2Fwww.keepingcurrentmatters.com%2F2014%2F08%2F08%2Fhome-prices-since-peak-infographic%2Fhttps://www.keepingcurrentmatters.com/2014/08/08/home-prices-since-peak-infographic/https%3A%2F%2Fwww.keepingcurrentmatters.com%2F2014%2F08%2F08%2Fhome-prices-since-peak-infographic%2Fhttps://www.keepingcurrentmatters.com/2014/08/08/home-prices-since-peak-infographic/https%3A%2F%2Fwww.keepingcurrentmatters.com%2F2014%2F08%2F08%2Fhome-prices-since-peak-infographic%2Fhttps://www.keepingcurrentmatters.com/2014/08/08/home-prices-since-peak-infographic/https%3A%2F%2Fwww.keepingcurrentmatters.com%2F2014%2F08%2F08%2Fhome-prices-since-peak-infographic%2F
https://files.keepingcurrentmatters.com/wp-content/uploads/2014/08/07190435/Home-Prices-Since-The-Peak.jpg
1500
1941
The KCM Crew
https://assets.keepingcurrentmatters.com/wp-content/uploads/2017/01/KCMBannerNoWebsiteDarkLarge.png
The KCM Crew2014-08-08 07:00:052014-08-08 09:56:50Home Prices Since the Peak [INFOGRAPHIC]
Interesting stats but wondering why Austin is not on the map? It’s the hottest real estate market in the U.S. right now.
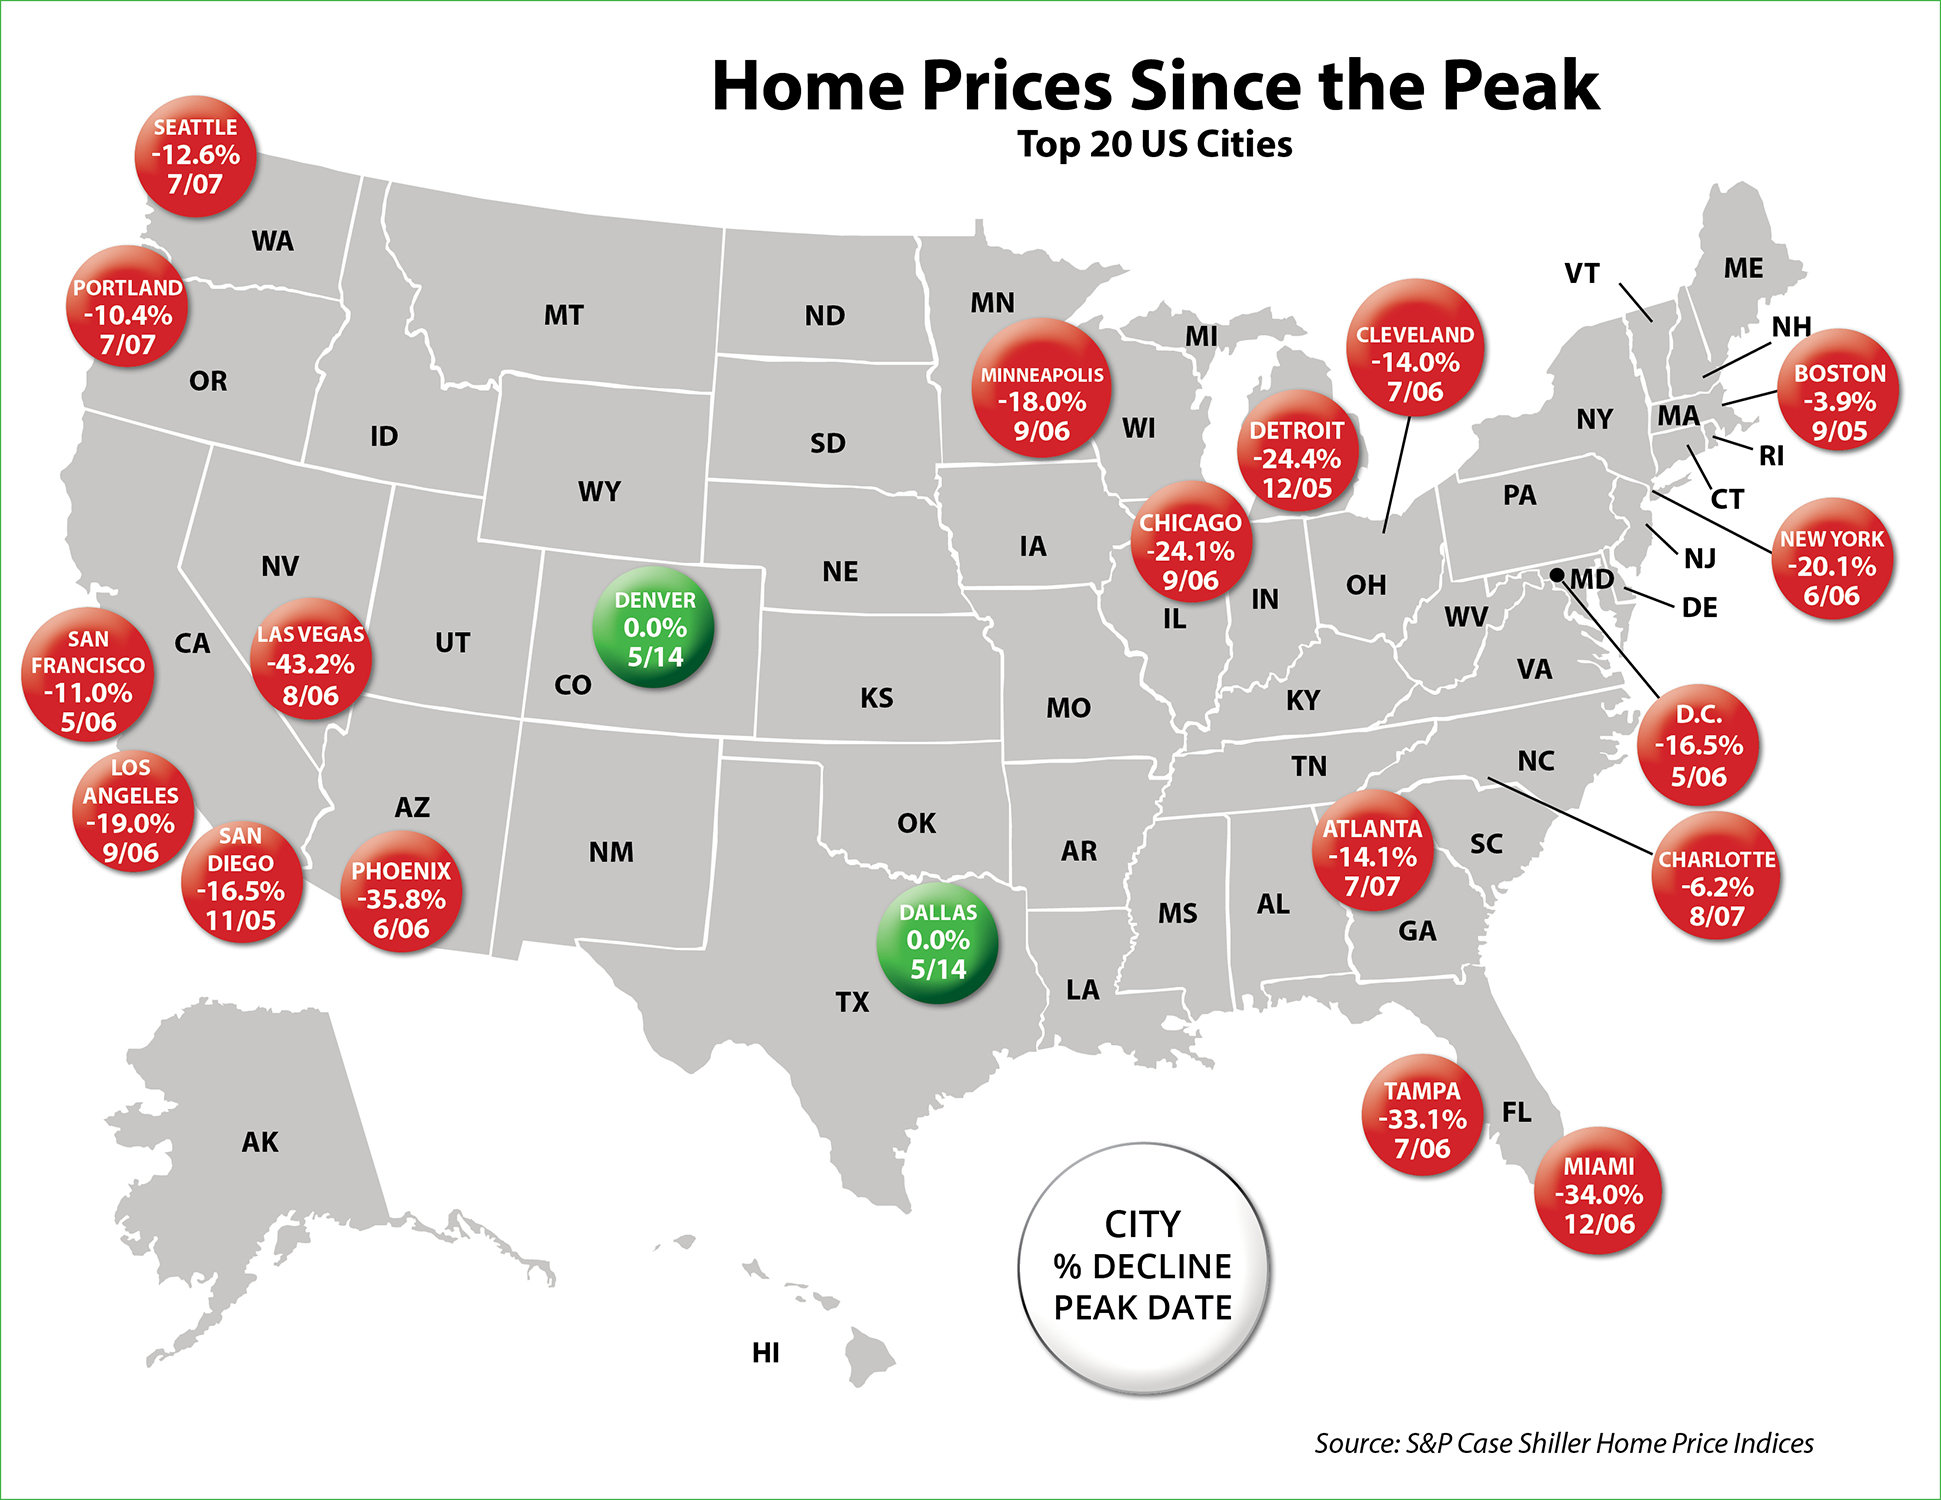
The cities that were included were determined by S&P/Case-Shiller’s Home Price Indices.
Interesting but this shows when the markets hit bottom. Where are the prices in these markets now- how far have they come back from the bottom?
Joanne…this infographic covers your question. It shows the where each city is still at compared to the the peak. As an example, in Portland (my market) we are still 10.4% lower in home prices than we were at the peak of the market for our area (July 2007).
Guess turnabout is fair play. S & P Case Shiller has never heard of Houston. Who the hell is S & P C S?