Keeping Current Matters
  • Products
    • Social Edge
    • Playbooks
    • RealTalk
  • Market Insights
  • Pricing
  • Blog
  • Login
  • Start a Free Trial
  • Menu Menu
  • English
  • Español
For Buyers, Infographics

New Home Sales Surge By 5.7%! [INFOGRAPHIC]

New Home Sales Surge By 5.7%! | Simplifying The Market

Some Highlights:

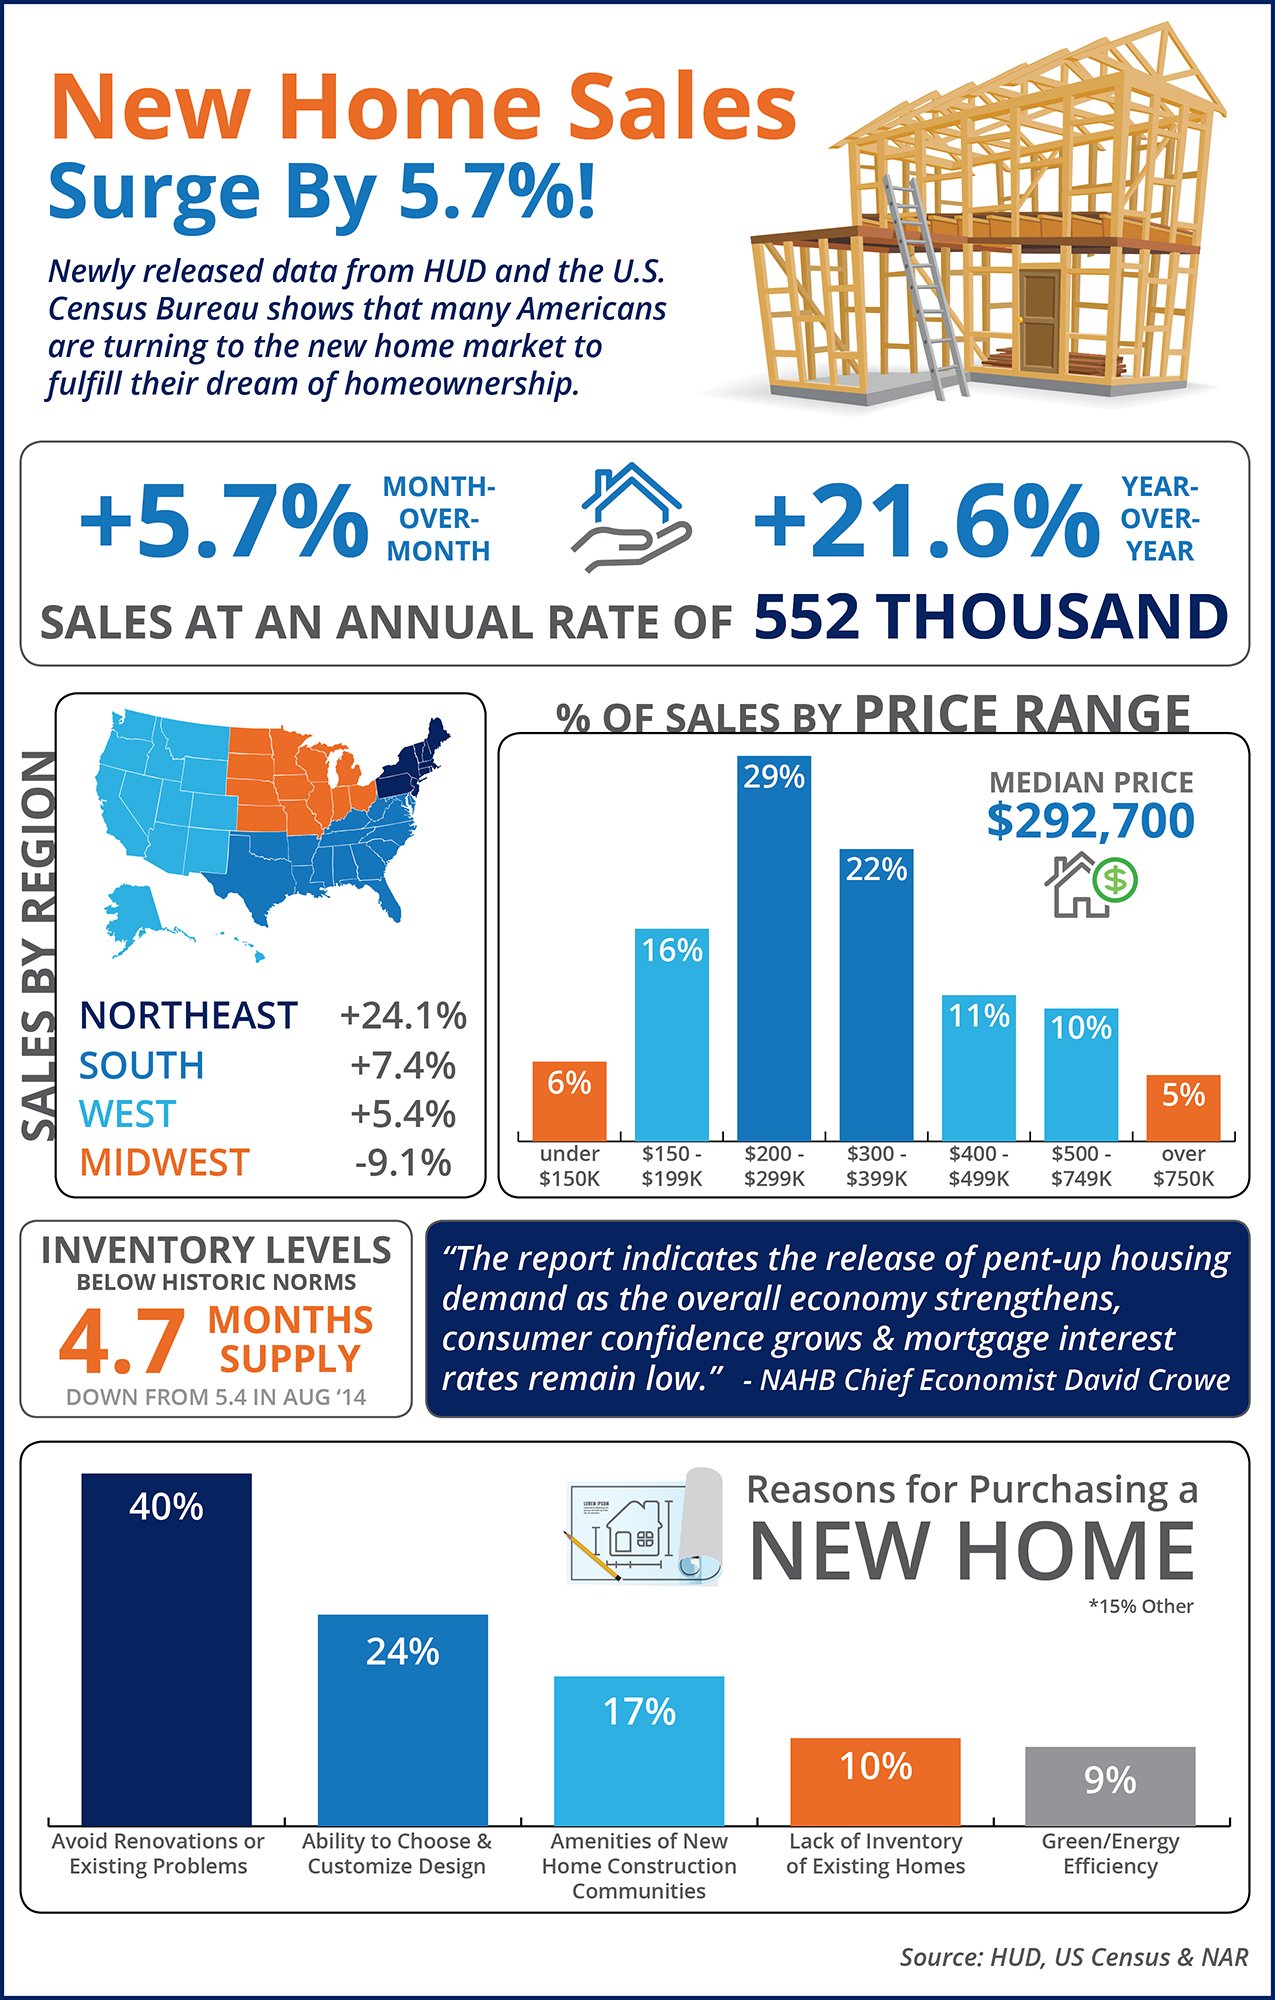
  • The median price of a newly constructed home is currently $292,700.
  • Sales are up 5.7% month-over-month and 21.6% year-over-year.
  • Many buyers are looking to new homes as an option due to the lack of inventory of existing homes for sale.
Read more →
October 9, 2015/by KCM CREW
For Buyers, For Sellers, Infographics

How Quickly Are Homes Selling In Your State? [INFOGRAPHIC]

How Quickly Are Homes Selling In Your State? [INFOGRAPHIC] | Simplifying The Market

Some Highlights:

  • The National Association of REALTORS® surveyed their members for their Confidence Index
  • The REALTORS® Confidence Index is a key indicator of housing market strength based on a monthly survey sent to over 50,000 real estate practitioners. Practitioners are asked about their expectations for home sales, prices and market conditions.
  • Homes sold in less than 60 days in 39 out of 50 states and Washington D.C.
  • Only Vermont had a median sold date longer than 90 days.
Read more →
October 2, 2015/by KCM CREW
For Buyers, For Sellers, Infographics

Existing Home Sales Slow Amongst Tight Inventory [INFOGRAPHIC]

Existing Home Sales Slow Amongst Tight Inventory [INFOGRAPHIC] | Simplifying The Market

Some Highlights:

  • Existing Home Sales slowed down slightly in August but remained 6.2% higher than August 2014.
  • Inventory levels remain below the 6 months necessary for a normal market at a 5.2-month supply.
  • First Time Buyers rebounded in August to make up 32% of sales, matching a 2015 high.
Read more →
September 25, 2015/by KCM CREW
For Buyers, Infographics, Mortgage Rates

Credit Score Requirements LOWER As Interest Rates CREEP UP! [INFOGRAPHIC]

Credit Score Requirements LOWER As Interest Rates CREEP UP! [INFOGRAPHIC] | Simplifying The Market

Some Highlights:

  • The average 30-year rate for all loans closed in August eclipsed 4.3% for the first time since October 2014.
  • The average FICO score for all closed loans in August reached a new yearly low at 724 (the lowest since February 2014!)
  • The average down payment of FHA loans closed was just 4%!
Read more →
September 18, 2015/by KCM CREW
For Buyers, For Sellers, Infographics

Economic Impact of Every Home Sold [INFOGRAPHIC]

Economic Impact of Every Home Sold [INFOGRAPHIC] | Simplifying The Market

Some Highlights:

  • Every time a home is sold, the surrounding economy feels a boost.
  • Different industries and businesses benefit at each stage of the process of moving into a home!
  • Hawaii leads the way with a $177,000 boost to the local economy.
Read more →
September 11, 2015/by KCM CREW
For Buyers, For Sellers, Infographics, For Sale by Owner

A+ Reasons to Hire A Real Estate Professional [INFOGRAPHIC]

A+ Reasons To Hire A Real Estate Professional [INFOGRAPHIC] | Simplifying The Market

Some Highlights:

  • Hiring a Real Estate Professional to buy your dream home, or sell your current house is one of the most 'educated' decisions you can make!
  • A Real Estate Professional has the experience needed to help you through the entire process.
  • Make sure that you hire someone who knows current market conditions & can simply & effectively explain them to you & your family!
Read more →
September 4, 2015/by KCM CREW
For Buyers, For Sellers, Infographics, Home Prices

NAR'S Latest Existing Home Sales Report [INFOGRAPHIC]

NAR'S Latest Existing Home Sales Report [INFOGRAPHIC] | Simplifying The Market

Some Highlights:

  • Existing Home Sales are up 10.3% year-over-year across the country.
  • Sales rose to an annual rate of 5.59 million marking the 10th month in a row of year-over-year gains
  • Prices are up 5.6% year-over-year in the U.S. to a median price of $234,000
  • Marked the 41st consecutive month of year-over year price gains.
Read more →
August 28, 2015/by KCM CREW
Infographics, Home Prices

Home Prices Up in 93% of Measurable Markets [INFOGRAPHIC]

Home Prices Up in 93% of Measurable Markets [INFOGRAPHIC] | Simplifying The Market
Read more →
August 21, 2015/by KCM CREW
Foreclosures, Infographics

Foreclosure Inventory Hits Lowest Mark in Over 7 Years [INFOGRAPHIC]

Foreclosure Inventory Hits Lowest Mark in Over 7 Years [INFOGRAPHIC] | Simplifying The Market
Read more →
August 14, 2015/by KCM CREW
Infographics

What You Need to Know About the Mortgage Process [INFOGRAPHIC]

What You Need to Know About the Mortgage Process | Simplifying The Market
Read more →
August 7, 2015/by KCM CREW
For Buyers, For Sellers, Infographics

Spring Buying Season Extends Into Summer [INFOGRAPHIC]

Spring Buying Season Extends Into Summer [INFOGRAPHIC] | Simplifying The Market
Read more →
July 31, 2015/by KCM CREW
Infographics, Mortgage Rates

Cost Across Time [INFOGRAPHIC]

Cost Across Time [INFOGRAPHIC] | Simplifying The Market
Read more →
July 24, 2015/by KCM CREW
For Buyers, For Sellers, Infographics

45% of Homes Sold in Less Than A Month! [INFOGRAPHIC]

45% of Homes Sold in Less Than A Month! [INFOGRAPHIC] | Simplifying The Market
Read more →
July 17, 2015/by KCM CREW
For Buyers, Infographics

Boomerang Buyers Coming Back in Force [INFOGRAPHIC]

Boomerang Buyers Coming Back in Force [INFOGRAPHIC] | Simplifying The Market
Read more →
July 10, 2015/by KCM CREW
For Buyers, For Sellers, Infographics

Homeownership Still The American Dream [INFOGRAPHIC]

Homeownership Still The American Dream [INFOGRAPHIC] | Simplifying The Market
Read more →
July 3, 2015/by KCM CREW
For Sellers, Infographics

Equity Report [INFOGRAPHIC]

Equity Report [INFOGRAPHIC] | Simplifying The Market
Read more →
June 26, 2015/by KCM CREW
For Buyers, Infographics, First-Time Buyers

Do I Need Perfect Credit to Buy a Home? [INFOGRAPHIC]

Do I Need Perfect Credit to Buy a Home? [INFOGRAPHIC] | Simplifying The Market
Read more →
June 19, 2015/by KCM CREW
For Sellers, Infographics, For Sale by Owner

Think You Should FSBO? Think Again! [INFOGRAPHIC]

Think You Should FSBO? Think Again! [INFOGRAPHIC] | Simplifying The Market

Some Highlights:

According to NAR's Profile of Home Buyers & Sellers:
  • 88% of buyers look for their new home online
  • Using a real estate agent can net you 13% more than FSBO'ing
  • There is a long list of people that you will have to negotiate with when you decide to sell your home, using an experienced professional can help ease the process.
Read more →
June 12, 2015/by KCM CREW
Infographics, Mortgage Rates

Mortgage Rates Over The Last 40 Years [INFOGRAPHIC]

Mortgage Rates Over The Last 40 Years [INFOGRAPHIC] | Simplifying The Market
Read more →
June 5, 2015/by KCM CREW
For Buyers, For Sellers, Infographics

Buyer Demand Exceeds Housing Supply [INFOGRAPHIC]

Buyer Demand Exceeds Buyer Demand [INFOGRAPHIC] | Simplifying The Market

Some Highlights:

  • Inventory Levels are still below the 6.0 month level necessary for a normal market
  • Home Prices have experienced year-over-year gains for 38 straight months
  • Home sold faster than any time since June 2013, in just 39 days
Read more →
May 29, 2015/by KCM CREW
For Buyers, Infographics, Mortgage Rates

The Difference Your Interest Rate Makes [INFOGRAPHIC]

The Difference Your Interest Rate Makes [INFOGRAPHIC] | Simplifying The Market
Read more →
May 15, 2015/by KCM CREW
For Buyers, Infographics, First-Time Buyers

Do You Know The Cost of Renting vs. Buying? [INFOGRAPHIC]

Do You Know The Cost of Renting vs. Buying? [INFOGRAPHIC] | Simplifying The Market
Read more →
May 8, 2015/by KCM CREW
For Buyers, For Sellers, Infographics, Move-Up

Where Should I Retire? [INFOGRAPHIC]

Where Should I Retire [INFOGRAPHIC] | Simplifying The Market

Read more →
May 1, 2015/by KCM CREW
For Buyers, For Sellers, Infographics, Home Prices

Existing Home Sales Skyrocket! [INFOGRAPHIC]

Existing Home Sales Skyrocket! [INFOGRAPHIC] | Simplifying The Market
Read more →
April 24, 2015/by KCM CREW
For Buyers, For Sellers, Infographics

I Need A VACATION... Home! [INFOGRAPHIC]

I Need A VACATION... Home!! [INFOGRAPHIC] | Simplifying The Market

Some Highlights:

  • Vacation Home Sales were up 57.4% in 2014
  • 1.13 Million Vacation Homes Sold
  • 2014 marked the highest level of sales in the U.S. since 2003
Read more →
April 17, 2015/by KCM CREW
Page 21 of 24«‹1920212223›»

Language:

  • English
  • Español


Categories

  • left-column
    • For Buyers
    • For Sellers
    • Infographics
    • Home Prices
    • Mortgage Rates
    • Inventory

  • left-column
    • Overview
      • Daily Blog Posts
      • Social Graphics
      • Videos
      • Buyer & Seller Guides
      • Market Reports & Visuals
      • Email & Newsletter Builder
      • Spanish Content
  • right-column
    • About KCM
      • Success Stories
      • Our Story
      • FAQs
      • News & Press
      • Group Membership
      • Contact
      • Careers

Contact Us

8720 Stony Point Pkwy
Suite 400
Richmond, VA 23235

(631) 787-6200

Email KCM
Copyright © 2026 - Keeping Current Matters | Privacy Policy | Terms of Service
  • Facebook
  • Twitter
  • Instagram
  • Youtube
  • LinkedIn
Scroll to top